|
|
|
The mission of the Laboratory of Optical Studies for Advanced Materials (LOSAM) aims to develop and characterize frontier materials with advanced optical techniques. To pursue the goal, LOSAM is equipped with (1) high-power femtosecond laser facility, (2) widely tunable picosecond coherent light sources; and (3) Yb-doped fiber laser pumped femtosecond laser with pulse shaping apparatus, etc. In this web page, I present a brief introduction of our research with quantum controlled technique for material dynamical study. The information was initially prepared for a discussion forum of my group. However, I will appreciate any feedback you are willing to give. |
Historical Overview of Quantum ControlThe ability to control the time evolution of a quantum system is of fundamental importance to quantum technology. A feasible scheme to offer such a control is via adaptive feedback control of light matter interaction. With the technique, one can steer the system toward a desired final state, while inhibit other possible paths that lead to undesirable outcomes. Quantum coherent control had been realized with femtosecond laser pulse shapers based on spatial light modulator (SLM). From historical overview (see here), two types of quantum control methodologies had been developed: 1. Time-domain approach: pioneered by Tannor and Rice 2. Frequency-domain approach: pioneered by Brumer and Shapiro. Functionality of both approaches had been verified experimentally on small gas-phase molecular systems. Adaptive Quantum Control Adaptive coherent control can offer dynamic information of a quantum system by interrogating it without a priori knowledge of its Hamiltonian. Several algorithms have been developed to help tailor the coherent optical field based on fitness information. Judson and Rabitz were the first to realize that molecular systems could be controlled by application of adaptive learning schemes with laser-pulse shaping technique. The technique has formed the basis of many experiments over the past two decades. Recent studies had demonstrated several feasible ways to achieve the goal of adaptive quantum control. We had also developed a freezing phase algorithm to achieve the optimal condition and retrieve the complete field characteristics of the optical pulses used. Current study with femtosecond coherent control technique aims not only to control the evolution of a complex system but also to deduce the underlying dynamic mechanism from the optimal laser field. To further advance the field, it is important to derive the physical meaning of an adaptive control from the characterization of a system’s response. In this regard, a variety of spectroscopic techniques serves as a valuable tool to verify the controllability and to interrogate control mechanisms. However to prove the usefulness, it is imperative to understand how spectroscopic information is embedded in the results of adaptive optimizations. In the adaptive quantum control with femtosecond pulse shaper, phase-only shaping affects the time ordering of the constituent frequencies in a given pulse without changing its fundamental spectrum of the laser pulse. The only way to encode information into the phase of a laser pulse is to go through coherently manipulable processes. |
Freezing Phase Algorithym for Adaptive Feedback ControlThe Principle We first illustrate the principle of the freezing phase algorithm (FPA) with a coherent pulse containing only four spectral components: \(E(t) = \sum\nolimits_{n = 1}^{n = 4} {{\nu _n}(t){e^{i{\phi _n}(t)}}} \). Figure 1(a) shows the phase-distorted pulse on the complex field plane. To freeze the spectral phases, we first pick up a spectral component, for example, \({\nu _4}{e^{i{\phi _4}}}\) and align it to the combined direction of the rest three components (see Fig. 1(b)). The same procedure is repeated for \({\nu _3}{e^{i{\phi _3}}}\), \({\nu _2}{e^{i{\phi _2}}}\), and \({\nu _1}{e^{i{\phi _1}}}\) as illustrated in Figs. 1(c)–1(e) until a frozen state is reached (Fig. 1(f)). 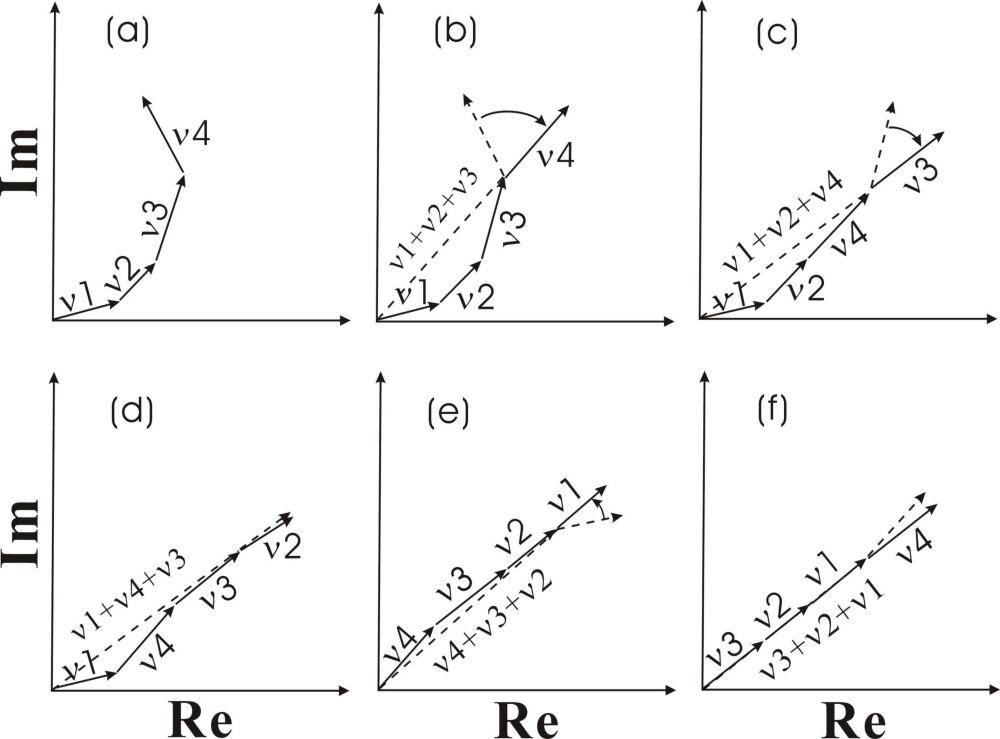
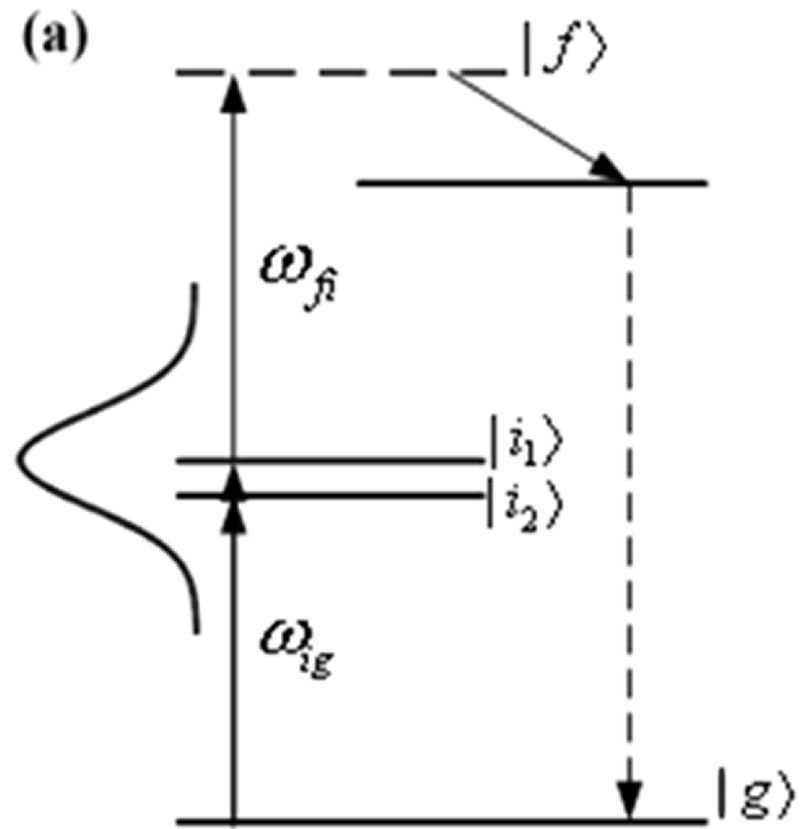
FIG. 1. Schematic diagrams showing successive freezing steps of a phase-distorted coherent pulse. For simplicity, the spectral phase profile of the optical pulse is represented with four spectral phase components. Simulation To show the wide applicability of our freezing phase algorithym (FPA), we applied our FPA on a two-photon absorption (TPA) process. The model system has an energy level structure as detailed in Fig. 2(a).
(a)
 ...
(b)
...
(b)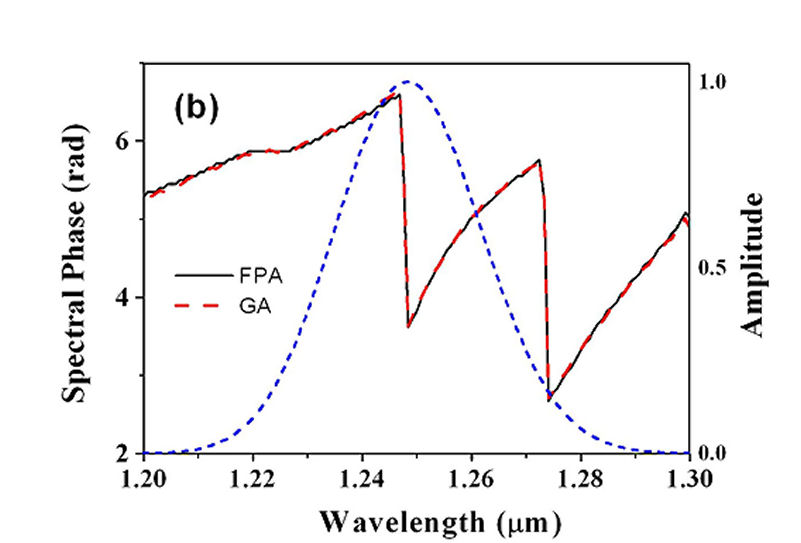
FIG. 2.(a) Energy-level diagram of TPA process. Two intermediate levels, |i1> and |i2> at 1247 nm and 1273 nm, are covered by the spectral range of the ultashort pulse used (see the dotted curve in Fig. 2b). (b) The phase profiles obtained with FPA (solid line) and genetic algorithm (dashed curve) by maximizing the TPA probability. The model system is excited with an ultrashort laser pulse \(E(t) = IFFT[E(\omega )] = IFFT[A(\omega ){e^{i\Phi (\omega )}}]\). We applied FPA to maximize the two-photon transition probability by adjusting the spectral phase \(\Phi (\omega )\) of the ultrashort pulse. Two intermediate levels are assumed to lie at 1247 nm and 1273 nm, which are within the spectral range of the input pulse. We compared the FPA result to that with genetic algorithm (GA). The genetic algorithm is implemented with a population size of 200, which comprises of 90 fittest individuals from the previous generation, 10 randomly generated individuals, from cross operation, and 40 from mutation of the 90 fittest parents. The simulated results are presented in Fig. 2(b). The optimum spectral phase profiles deduced from GA and FPA are nearly identical. However, our FPA scheme can yield the result with a faster speed. In addition, for practical applications noise influences are a crucial factor. In this regard, GA was found to be more sensitive to the fluctuation of laser power. This is because as the laser power decreases, GA tends to judge all individuals after this power reduction to be poorer than that of the previous generation. This erroneous judgment does not happen with the freezing phase algorithm. More information |

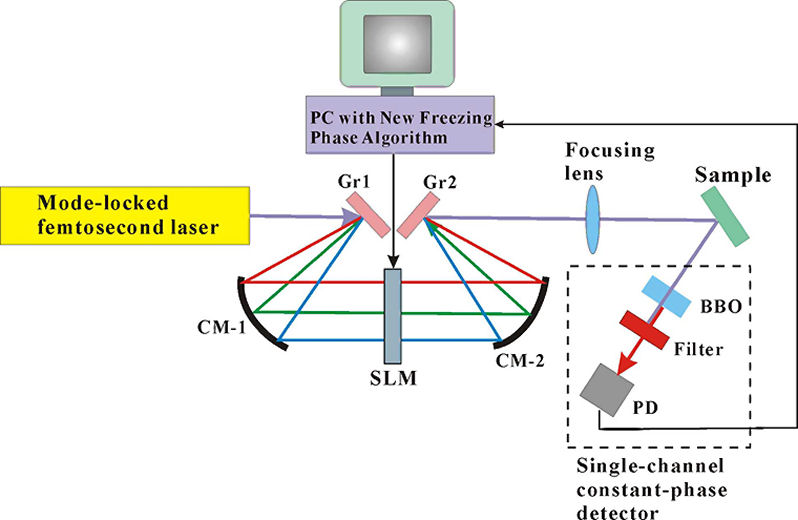
Quantum Control ApparatusThe adaptive pulse shaping apparatus used in this study consists of a CW mode-locking \({\rm{C}}{{\rm{r}}^{4 + }}\): forsterite laser. The output of the laser was 280 mW of average power at a repetition rate of 76 MHz with a central wavelength of 1.253 \(\mu m\). The full-width-at-half maximum (FWHM) bandwidth was 42 nm, corresponding to 50-fs pulse duration. TPF spectrum was acquired with a spectrograph combined with a cooled CCD camera. An integrated spectrum over a specific wavelength range was feedback to control the phase retardation pattern of a liquid crystal SLM inserted in a 4-f pulse shaping system.
(a)
 ...
(b)
...
(b)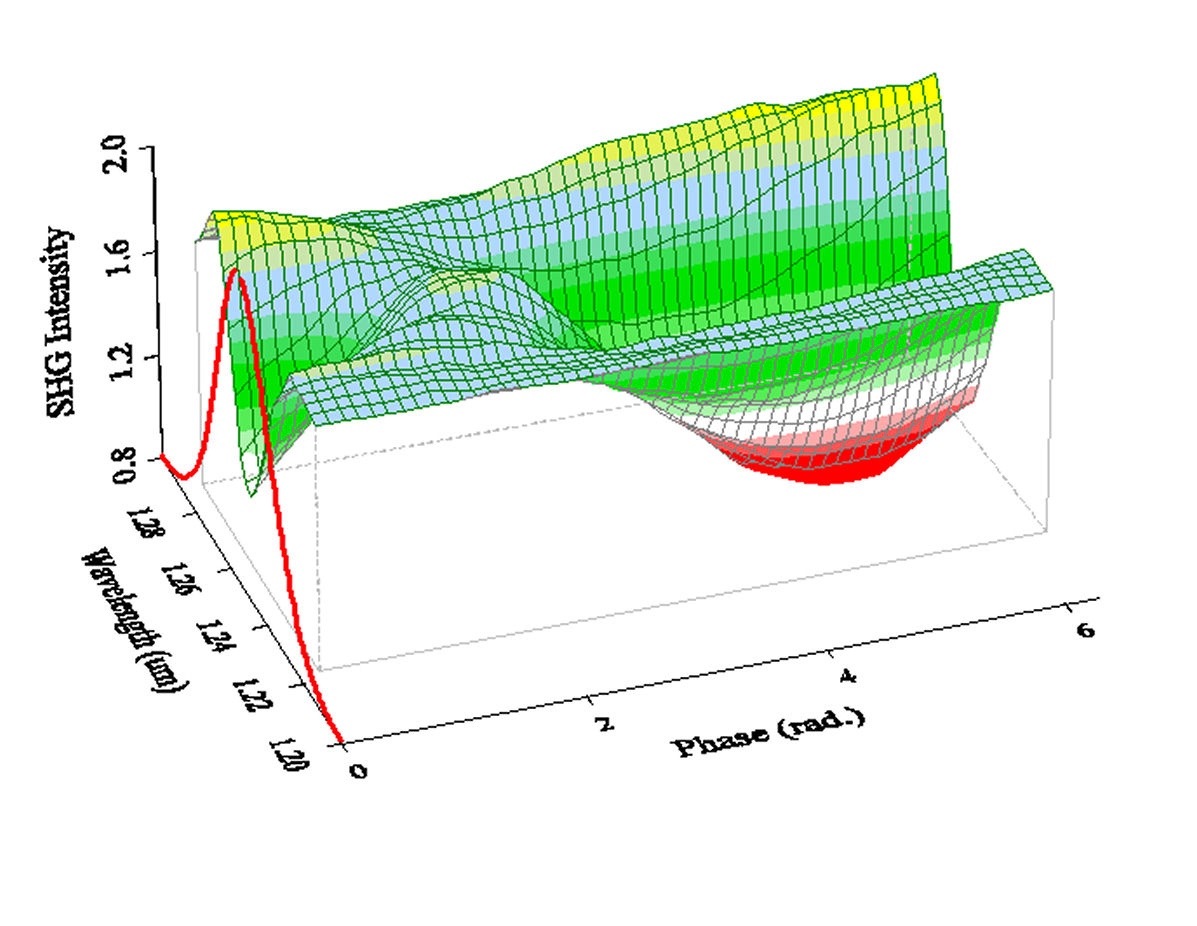
FIG. 3. (a) Schematic of an adaptive pulse shaping setup. The apparatus is comprised of an all reflective 4-f pulse shaper. Here Gr1 and Gr2 denote a pair of gratings, CM-1 and CM-2 two concave reflectors with 10-cm focal length, SLM one-dimensional pixelated spatial light modulator, BBO a 3-mm thick type-I β-Ba2BO4 second-harmonic crystal, and PD a photodiode detector. (b) Measured SHG signal with an optical pulse reflected from a gold-coated mirror is plotted as a function of the phase retardation of the phase modulation group of two consecutive pixels and their corresponding wavelength in a 4-f pulse shaper apparatus. To experimentally verify the function of FPA we first divide the SLM pixels into two groups: the first group, which involves two neighboring pixels, plays the role of phase modulation. The other group, which contains the remaining 126 pixels, is used as the reference. The phase of the modulation group is then varied from 0 to 2\(\pi \) for maximizing the SH intensity. The procedure is repeated by regrouping the SLM pixels until the phase retardations of all pixels are properly adjusted. The experimentally measured SHG signal generated by an optical pulse reflected from a gold-coated mirror is shown in Fig. 3(b). For reference, the spectrum of the mode-locked laser pulse is also plotted along the y-axis to mark the corresponding wavelengths of the SLM pixels. The SHG modulation patterns yield information about the phase distortion of the optical pulse. |
Case Study 1: InAs QD DevicesSemiconductor quantum dots are promising candidates for a number of optoelectronic applications, including lasers, photovoltaic devices, and photon detectors. It had been found that the optical properties of InAs QDs strongly depend on the embedded matrix of the quantum dots. In this study, we showed that the dynamic response of InAs QDs can be revealed in the optimized phase profile yielded from adaptive control two-photon excited fluorescent (TPF) measurements. The femtosecond dynamics was verified by two-dimensional coherent spectroscopy (2D CS) and was attributed to originate from an exciton-phonon coupling in InAs QDs. A. Device Structure The schematic of the device structure and the associated band diagram are shown in Fig. 4. The fabrication process starts with a 300 nm-thick GaAs buffer layer on a semi-insulating GaAs (100)-oriented substrate. A monolayer of InAs QDs was grown at 530\(^{\rm{o}}{\rm{C}}\) in Stranski-Krastanov growth mode. The QDs were covered with a 6 nm-thick \({\rm{I}}{{\rm{n}}_{0.18}}{\rm{G}}{{\rm{a}}_{0.82}}{\rm{As}}\) layer, which acts to increase the confinement potential, reduce the compressive strain in InAs QDs and suppress the indium segregation. The samples were capped with a 100 nm-thick GaAs overlayer. 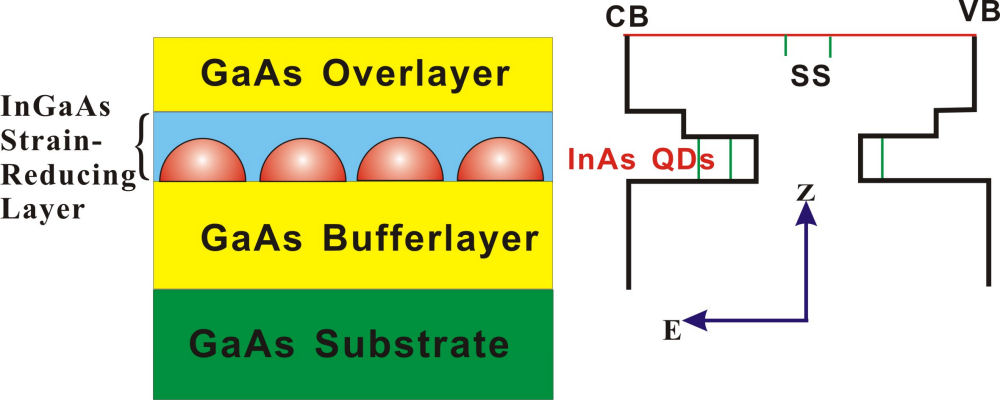
FIG. 4. Schematic diagrams showing the device structure of InAs QDs used in this study and its energy band structure. B. Photoluminescence characterization Figure 5 shows the one-photon excited photoluminescent (PL) spectra of the devices with two types of SRLs (S3355: \({\rm{I}}{{\rm{n}}_{0.18}}{\rm{G}}{{\rm{a}}_{0.82}}{\rm{As}}\) (blue solid line); S3357: \({\rm{I}}{{\rm{n}}_{0.18}}{\rm{G}}{{\rm{a}}_{0.82}}{\rm{AsSb}}\) (red dashed curve)). The PL was excited by a solid-state laser of wavelength 532nm with an excitation power of about 50 W/cm2 at the device surface. Photoluminescence (PL) spectrum of InAs QDs capped by a 6 nm-thick \({\rm{I}}{{\rm{n}}_{0.18}}{\rm{G}}{{\rm{a}}_{0.82}}{\rm{As}}\) SRL at room temperature shows strong PL peak from the ground state transition at 1340 nm. The energy separation between ground- and excited state is about 80 meV with a FWHM linewidth of 26 meV. The narrow FWHM spectrum of QDs with InGaAs SRL indicates a small variation in the InAs QD height. Incorporation of Sb element into \({\rm{I}}{{\rm{n}}_{0.18}}{\rm{G}}{{\rm{a}}_{0.82}}{\rm{As}}\) SRL with a Sb flux of \(1.2 \times {10^{ - 6}}\) Torr shifts the PL peak from the ground state transition down to 1420 nm. The energy separation between ground- and excited state decreases to 52 meV in accompany with an increased FWHM linewidth of 62 meV. 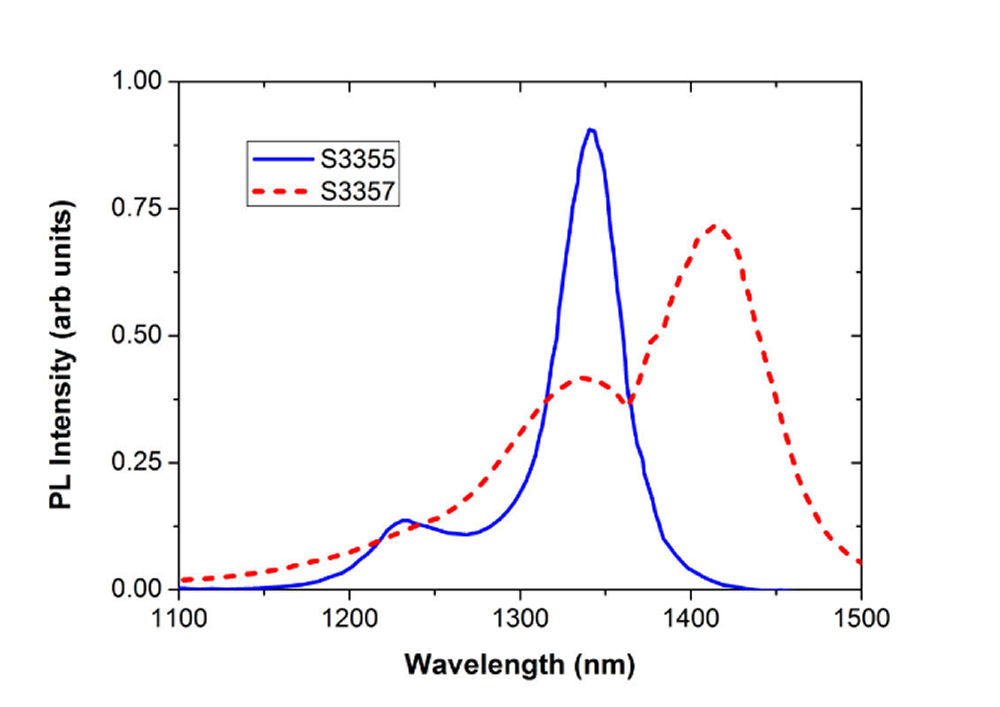
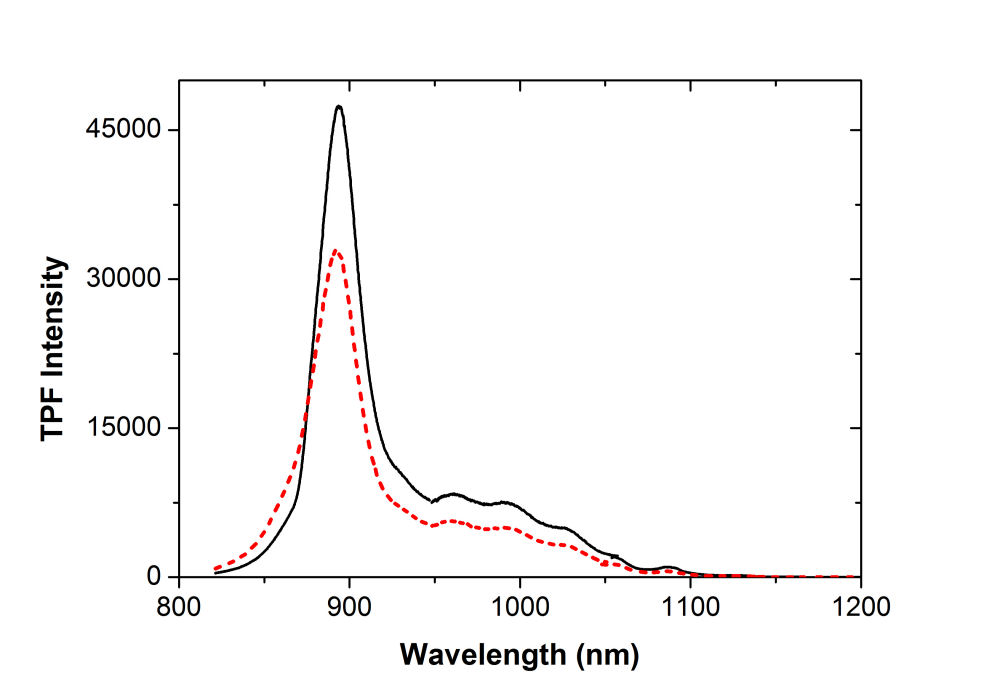
FIG. 5. One-photon excited photoluminescent emission spectrum of InAs quantum dot devices with different types of strain-reducing layer (InGaAs: blue solid curve; InGaAsSb: red-dashed curve). C. Two-photon excited fluorescent emission The devices under test were excited by the CW mode-locking laser at 1.253 \(\mu m\). The resulting TPF spectrum from the device S3355 is shown in Fig. 6(a). The peak at 895 nm is due to the near band edge emission from the GaAs overlayer. Note that the TPF from a similar device without the SRL was found to peak at 868 nm. A 27-nm red shift was determined for the near band edge emission from the GaAs overlayer of S3355. This is due to a biaxial stress in GaAs, which breaks the degeneracy of Iight- and heavy-hole valence bands, causing an energy band gap reduction when the GaAs epilayer is subject to a tenssile strain. Above 950 nm, five peaks can be found at 965, 1000, 1030, 1060, and 1090 nm. It is well established that elastic strain induced by the lattice parameter mismatch between epilayers results in significant energy–band‐gap shifts for III‐V alloys. These TPF features can therefore be attributed to the near band edge emission from the different parts of SRL with varying degrees of strain. Indeed, PL peaks at 940 nm, 1097 nm and 1425 nm from an \({\rm{I}}{{\rm{n}}_{0.08}}{\rm{G}}{{\rm{a}}_{0.92}}{\rm{As}}\)/GaAs heterojunction had been observed and were attributed to from the top free surface, the internal strained layer and the interfacial region of InGaAs, respectively. TPF from S3357 (red dashed curve in Fig. 6(a)) exhibits similar spectral profile but 30% weaker than that of S3355.
(a)
 ...
(b)
...
(b)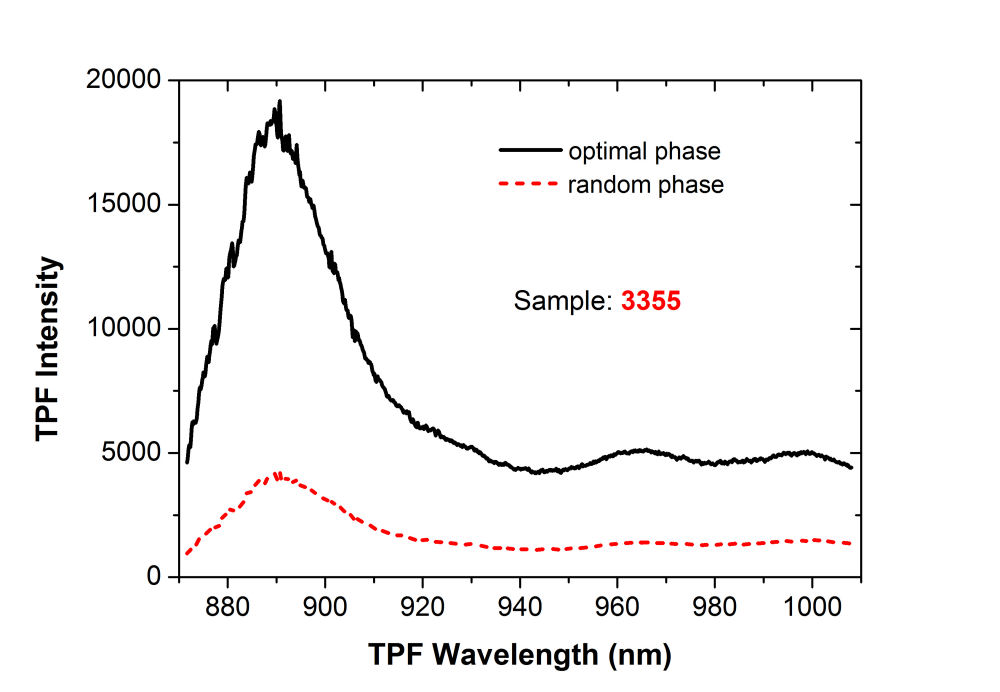
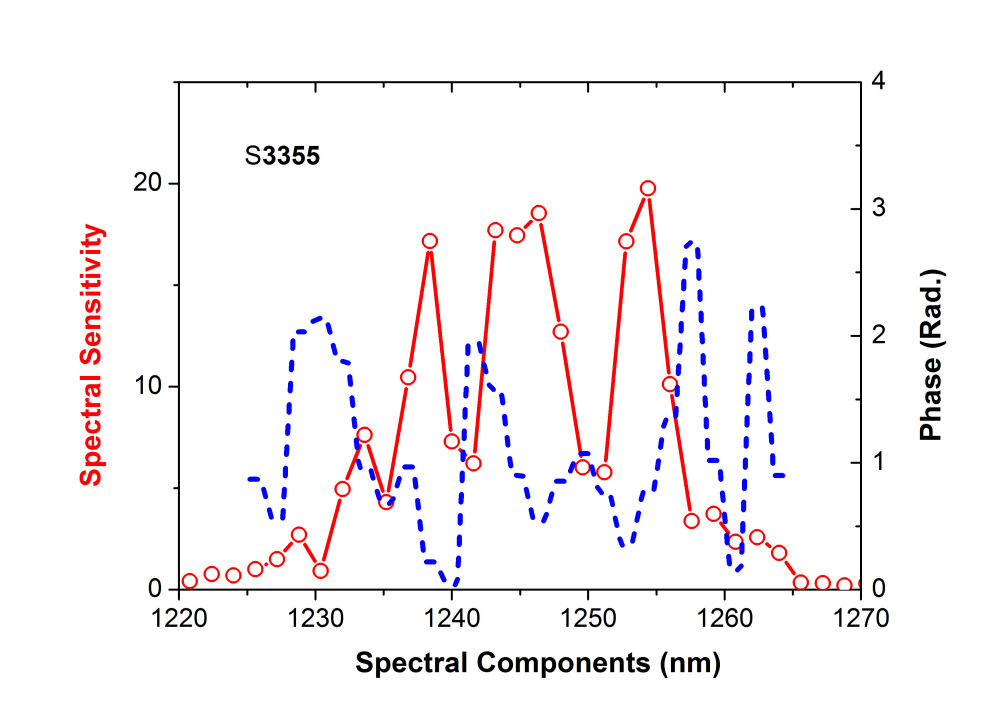
FIG. 6. (a) Two-photon excited emission spectrum of the InAs quantum dot device with \({\rm{I}}{{\rm{n}}_{0.18}}{\rm{G}}{{\rm{a}}_{0.82}}{\rm{As}}\) SRL (black solid line) and \({\rm{I}}{{\rm{n}}_{0.18}}{\rm{G}}{{\rm{a}}_{0.82}}{\rm{AsSb}}\) (red dashed curve) SRL. (b) Coherent controlled two-photon excited emission spectrum of the InAs QDs/InGaAs SRL device excited by 1.253 \(\mu m\) femtosecond laser pulses with random retardation profile (red dashed curve) and a phase retardation profile optimized for maximum TPF (black solid curve). D. Coherent control TPF emission (ccTPF) By using an adaptive control pulse shaper with FPA, we can optimize the TPF signal from 870 to 1010 nm by adjusting the spectral phase of the input ultrashort laser pulse. The measured TPF signal from S3355 is presented in Fig. 6(b). The TPF spectrum (red dashed curve) was acquired with shaped pulses by imposing a random retardation profile on the SLM. The spectrum with black solid curve was taken with femtosecond laser pulses shaped by the retardation pattern that yields the maximal TPF signal. More than four times increase in the ccTPF signal can be achieved. Note that phase-only shaping only affects the time ordering of the constituent frequencies in a given pulse without modifying the fundamental spectrum of the laser pulse used. Thus by using phase-only shaping technique we can ensure that only coherently manipulable processes are involved to vary the signal shown in Fig. 6(b). E. Spectral-phase sensitivity of ccTPF A spectral-phase sensitivity \(S(\omega )\) can be defined to reflect how efficient a spectral component in a given pulse to channel the photon energy into a material system. For a chosen spectral component, we define the spectral-phase sensitivity \(S(\omega )\) to be the difference of the maximal and minimal TPF signal as the spectral phase is varied from 0 to 2\(\pi \). Figure 7(a) shows the spectral-phase sensitivity of TPF from S3355 and the optimal phase retardation pattern that generates the maximal TPF signal shown in Fig. 7(b}. Several peaks and valleys were observed in the spectral phase sensitivity plot, resulting from multiple TPA processes with different phases. In contrast, we obtained a smoother sensitivity profile from S3357 (see Fig. 7(b)). It was discovered that the valence band offset of a quaternary GaInAsSb layer surrounded by GaAs can be modified by the incorporation of Sb element, therefore the potential barrier with InAs QDs in S3357 can be altered. Indeed, as shown in Fig. 5, the quaternary GaInAsSb layer in S3357 shifts the transition energy of the ground and the excited states of InAs QDs to outside of the spectral range covered by the excitation laser pulse. As shown in our previous publication, \(S(\omega )\) and the optimal phase pattern \(\Phi (\omega )\) carry the complete information of light field interacting with a device. We compensated the phase distortion \({\Phi _{S3357}}(\omega )\) in S3357 with SLM to yield \(\Delta {\Phi _{S3357}}(\omega ) = {\Phi _{S3357}}(\omega ) - {\Phi _{SLM}}(\omega ) = 0\). The red dashed curve in Fig. 7(c) shows the Fourier transform \({S_{3357}}(\omega ){e^{i\Delta {\Phi _{S3357}}(\omega )}}\) to the time domain. As expected, the resulting TPF response function without an intermediate resonant level, is dominated by the autocorrelation of the laser pulse. The TPF response function of S3355, given by the Fourier transform of \({S_{3355}}(\omega ){e^{i[{\Phi _{S3355}}(\omega ) - {\Phi _{S3357}}(\omega )]}}\), is shown by the blue solid curve. Because the excited state resonance of InAs QDs lies at the high frequency side of the laser spectrum, the response profile is asymmetric. The TPF responsive profile of S3355 exhibits an enhanced response peak at 260 fs, which can be attribute to originate from the resonance with the excited state of InAs QDs.
(a)
 (b)
(b)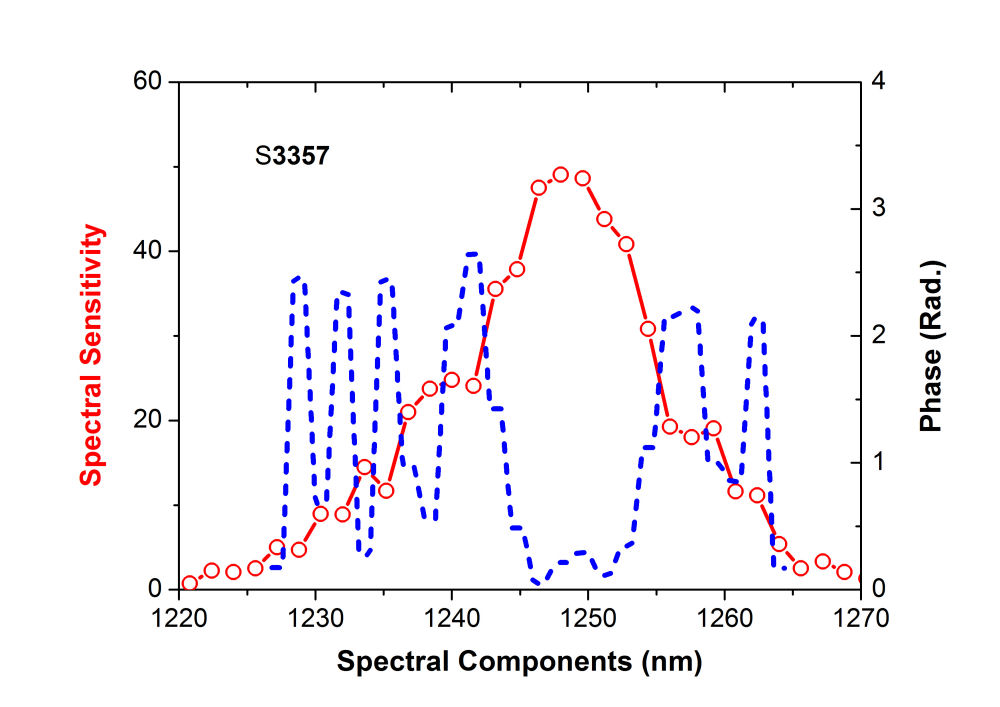 (c)
(c)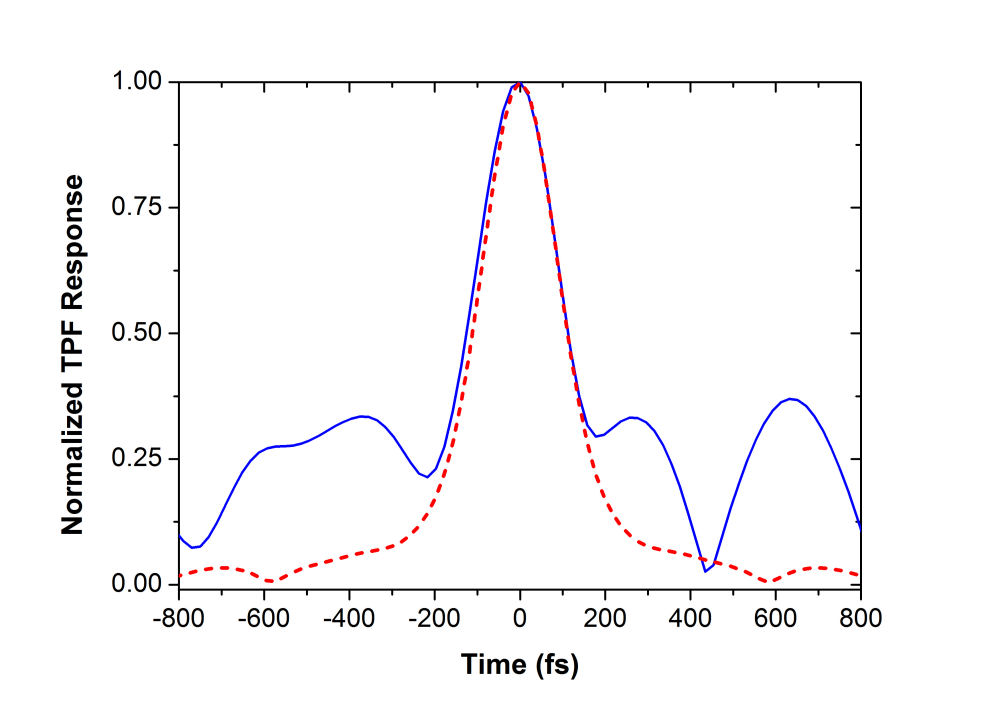
FIG. 7. Spectral-phase sensitivity curves of two-photon fluorescence (TPF) and the spectral-phase patterns used to yield maximum TPF signal from the InAs quantum dot device with (a) InGaAs, (b) InGaAsSb strain-reducing layer . (c) Fourier transform of the spectral-phase sensitivity function shown in (a) blue solid curve and (b) red dashed curve. InAs QDs devices with different types of strain-reducing layers had been fabricated to demonstrate the effectiveness of the strain-reducing layers. By combining one-photon and two-photon excited fluorescent spectroscopies, varying degrees of strain were revealed to be embedded in the \({\rm{I}}{{\rm{n}}_{0.18}}{\rm{G}}{{\rm{a}}_{0.82}}{\rm{As}}\) layer. Incorporation of Sb into the \({\rm{I}}{{\rm{n}}_{0.18}}{\rm{G}}{{\rm{a}}_{0.82}}{\rm{As}}\) SRL does not cause a significant change in the near band edge emission of the SRL, but can effectively red shift the ground and excited state transition energies of InAs QDs. We also showed that the optical excitation dynamics of InAs QDs can be retrieved with coherent control TPF. The ccTPF of the device under study exhibits a resonant response at 260 fs, which can be attributed to originate from the resonance with the excited state of InAs QDs. We further employed 2D CS to decipher the resonant response and found it to originate from an ultrafast exciton-acoustic phonon coupling in InAs QDs, showing the coupling effect plays an important role in the coherent relaxation process of exciton in the quantum-confined structure. The wealth of dynamical information revealed in this study deepen our understanding of semiconductor quantum dot devices and could help engineers to design more efficient quantum dot devices that were known to have a wide application spectrum. More information If you have any feedback you like to share, please hit |
