|
|
|
The mission of the Laboratory of Optical Studies for Advanced Materials (LOSAM) aims to develop and characterize frontier materials and devices with advanced optical techniques. To pursue this goal, the laboratory is equipped with (1) high-power femtosecond laser facility, (2) widely tunable picosecond coherent light sources; and (3) Yb-doped fiber laser pumped femtosecond laser with pulse shaping apparatus; and (4) single-molecular detection and imaging apparatus, etc. In this web page, I present a brief introduction of our research with single-molecular detection and tracking for cellular events in live cells. The information was initially prepared for a discussion forum of my group. However, I will appreciate any feedback you are willing to give. |
|
I. Single-Molecule Optical Study of Signaling Machinery in Live CellsLive cells must execute a variety of cellular processes to survive in a changing environment. These processes can be organized into signaling network, transcription regulation network, and metabolic network. The signaling network is responsible for relaying messages from the external environment to the nucleus. Inside the nucleus, the transcription regulation machinery determines which genes are expressed and to what extent. The metabolic network serves as the energy and resource manager of the cell to support the cellular processes. A. Overview of The EGFR Signaling Pathway The first event of cellular signaling occurs at a variety of receptors on the plasma membranes that can transduce the instantaneous information presented to the cell. The epidermal growth factor receptor (EGFR/ErbB1) is a transmembrane protein, which contains an extracellular binding domain, a single transmembrane spanning domain, and a cytoplasmic tyrosine kinase domain. Ligands (including EGF) bind to the extracellular domain of EGFR, stimulating conformational changes that support receptor dimerization. Receptor dimerization leads to the activation of the intracellular tyrosine kinase domain and phosphorylates the dimerization partner on specific tyrosine residues. The phosphorylated tyrosine residues then function as docking sites for adaptor proteins, which further activate intracellular signaling cascades. Ultimately, these cascades result in alterations of gene expression, which determines the biological responses as depicted by the Ras–MAPK and PI3K-Akt signaling pathways. Diseased EGFR signaling had been shown to be the cause of some lung and breast cancers. 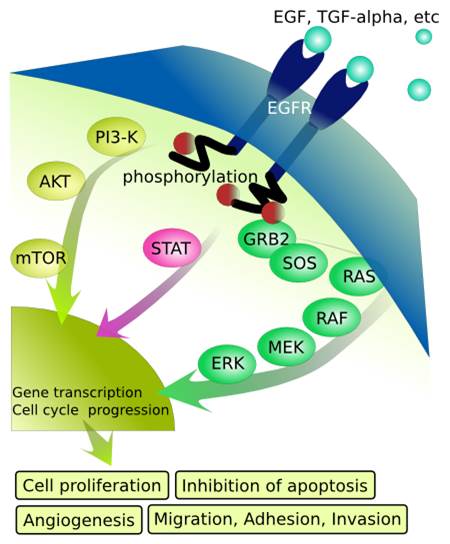
FIG.1: Schematic of the EGFR signaling pathway The EGFR can form homodimers with itself and heterodimers with other members of its receptor-family, such as ErbB-2. Previous study suggests that either dimers are preformed or EGF binds only to monomeric receptors that subsequently form dimers. ErbB-2 receptors can be overproduced in some cancers and that overproduction alters the dynamic behavior of the EGFR, presumably resulting from a shift of the normal distribution of EGFR homodimers to favor the EGFR–ErbB-2 heterodimers. This mechanism is poorly understood. We hope to decipher the mechanism to understand and manipulate receptor function at the molecular level. Diverse cell types with disparate signaling networks show different amounts of signaling arising from an activated EGFR–ligand complex. It had been shown that blocking EGFR ligand binding or inhibiting EGFR kinase activity with small-molecule inhibitors is difficult to suppress the extracellular-regulated kinase (ERK)-mediated cell responses. It would be valuable to measure the magnitude of MAPK signaling strength per ligand-receptor complex. B. Research Strategy To visualize EGFR on a live cell, we employ Cy3-tagged antibody (Ab-Cy3) to specifically label EGFR in the plasma membrane (Ab-Cy3-EGFR). Fluorescent EGF, synthesized by conjugating EGF with Alexa 488 (EGF-Ax488), was used to activate the EGFRs (EGF-Ax488-EGFR). 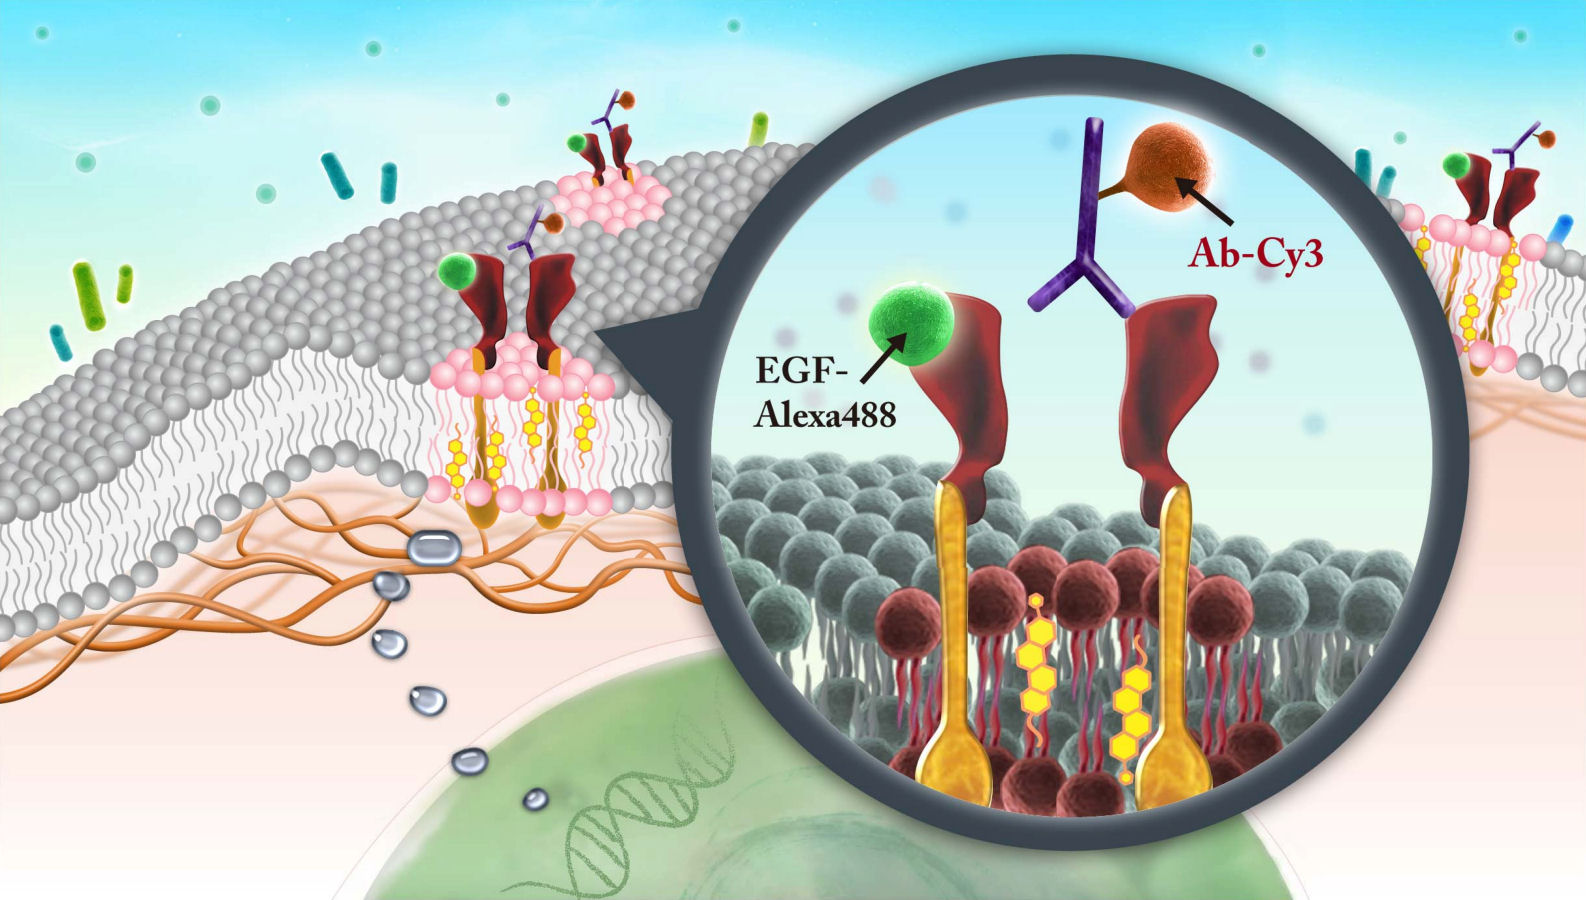
FIG. 2: Schematic diagram showing epidermal growth factor receptor (EGFR) dimers in the heterogeneous environment of plasma membrane. The meshwork underneath the lipid bilayer denotes the actin-based membrane skeleton. The labeling scheme used in this study: Ab-Cy3 denotes a cyanine 3 fluorophore conjugated to an EGFR antibody, and EGF-Ax488 is a fluorescent epidermal growth factor (EGF) synthesized by conjugating EGF with Alexa 488 fluorophore. We can quantitatively deduce the concentrations of these visible EGFR species (i.e., EGF-Ax488, Ab-Cy3, EGF-Ax488+Ab-Cy3), we acquired fluorescent images of live He-La cells, which were immuno-stained with Ab-Cy3 and then activated by EGF-Ax488. The results are shown in Fig. 3. The areas of the cells were first delineated. We then integrated the fluorescent intensity over each cell region. By using the molar extinction ratios and fluorescent quantum yields of the fluorophores, we can deduce the concentrations of Ab-Cy3 labeled EGFR and EGF-Ax488-activated EGFR in the fixed cells. Assuming that the total number of EGFR on a cell is N and the binding efficiency of the antibody (Ab-Cy3) to EGFR is \(\eta \), we found \([{\rm{EGF}} - {\rm{EGFR}}]/[{\rm{Ab}} - {\rm{EGFR}}] = (x + y)/(\eta N)\)=0.38 where x and y denote the concentrations of the EGF-Ax488-EGFR with or without Ab-Cy3 label. From the co-localization measurement of the two fluorophores (see Fig. 3), we determined \(x = 0.124\eta N\). 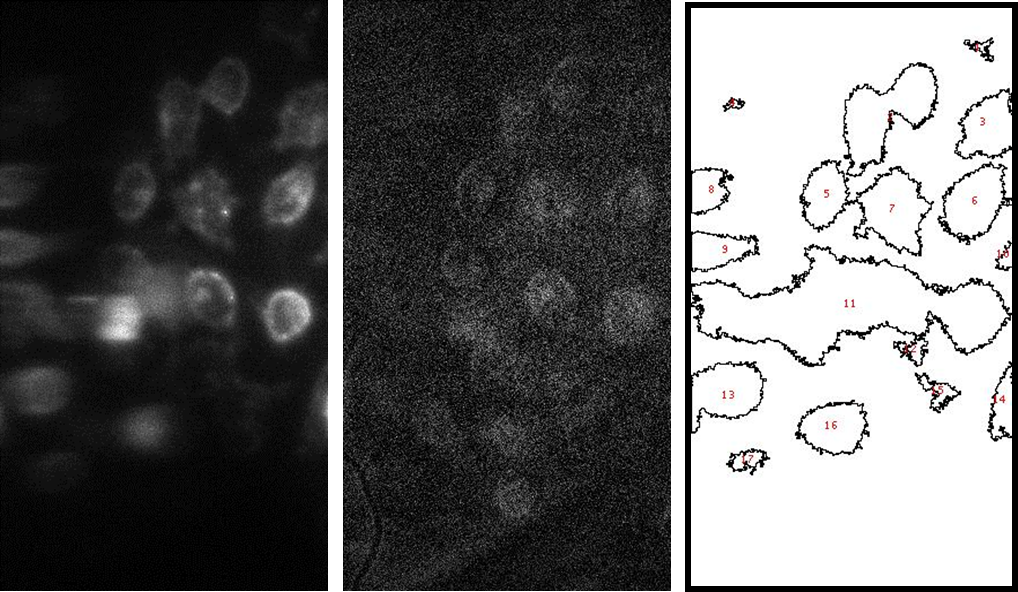
FIG. 3: (a) Fluorescent image of Ab-Cy3 on live He-La cells. (b) Fluorescent image of EGF-Ax488 on the cells. (c) The cell mask deduced from the images. By summarizing the results of the measurements, we found the concentrations of the inactivated Ab-Cy3-EGFR and the EGFR-EGF-Ax488 to be about \((\eta N - x)/(\eta N) = 1 - 0.12 = 0.88\) and \(y = 0.26\eta N\), respectively. 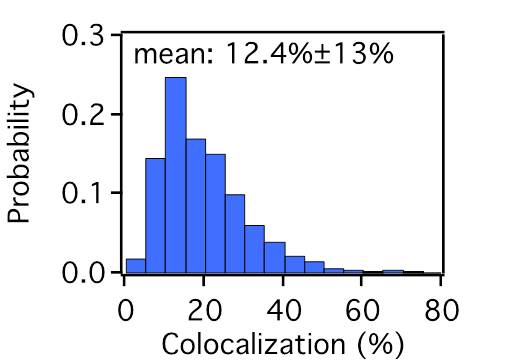
FIG. 4: Probability density distribution of colocalized Ab-Cy3-EGFR and EGF-Ax488-EGFR on live He-La cells. C. Statistics of single-molecule trajectories and fluorescent emission from two-color labeled EGFR Because the two labeling processes are statistically independent, we found only 12% of the Ab-Cy3-EGFR are activated by EGF-Ax488. This results in a very small EGF-induced change in the distribution of diffusion constant of Ab-Cy3-EGFR (see Fig. 5(a)). To verify the formation of EGFR dimer induced by EGF, we measured the trajectories of EGFR-EGF-Ax488 in order to deduce the distribution of diffusion constant. The diffusion constant of EGFR-EGF-Ax488 peaks at 0.01 μm2/s, which is a factor of 2.5 smaller than that (0.025 μm2/s) of Ab-Cy3-EGFR. The formation of EGF-induced EGFR dimer was also confirmed by the probability density function (PDF) of fluorescent signal emitted from EGF-Ax488-EGFR and Ab-Cy3-EGFR. Upon activation by EGF, the PDF of fluorescent signal from the Ab-Cy3-EGFR peaks at \(1.5 \times {10^4}\) with a negligible increase by EGF (see the blue and red curves). However, the PDF of fluorescent signal from EGF-Ax488-EGFR peaks at \(3.0 \times {10^4}\), indicating a formation of EGFR dimer. Note that the measured fluorescent signals had been properly corrected for the differences of optical absorbance and fluorescent quantum yield of different fluorophores. 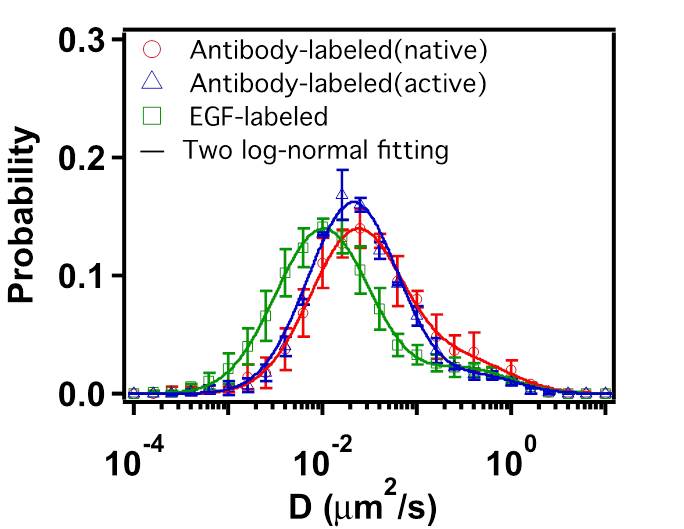 __ __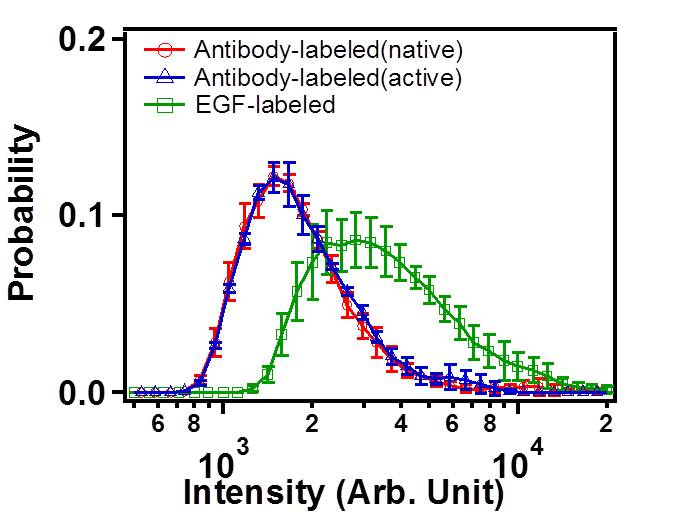
FIG.5: (Left) Distribution of diffusion constant and (Right) distribution of fluorescent signal from EGFR. red: Ab-Cy3-EGFR without EGF, blue: Ab-Cy3-EGFR with EGF, and green: EGF-Ax488-EGFR. D. Response of downstream signaling proteins An important thing to check is that the observed differences in moment analysis of single-molecule trajectories lead to different levels of downstream signaling proteins. Two important downstream proteins in the EGFR pathway are MEK and ERK. We use appropriate antibodies to recognize the phosphorated species of p-MEK and p-ERK after certain times of EGF activation. Figure 6 presents the concentrations of p-MEK and p-ERK in rest cells (open bars) and in activated cells (filled bars) measured at 10 min after adding 0.01 mg/l (blue) and 0.1 mg/l (green) EGF. Apparently at this moment, the signal has passed through MEK and reached at the maximum level of p-ERK. Detailed study of the dynamic responses of downstream signaling proteins to EGFR activation and their relevance to the EGFR dimerization and nano structures of cell membrane will be reported shortly. 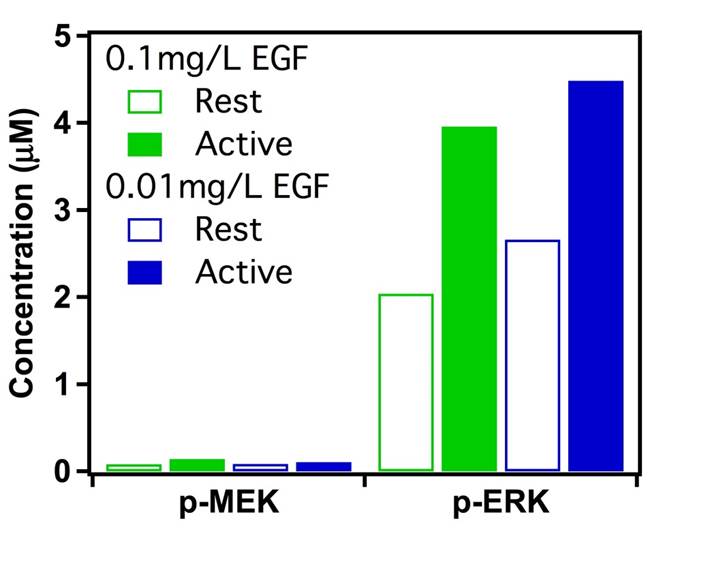 __ __
FIG.6: Concentrations of p-MEK and p-ERK in fixed He-La cells (open bars: without EGF, filled bars: 10 min after adding EGF). E. Information of correlated motion retrieved from single-molecule trajectories As mentioned above, the EGFR can form homodimers/heterodimers, which activate the intracellular tyrosine kinase domain to initiate the intracellular signaling cascades. It is important to know how EGFR undergoes the dimerization process at both the rest state and bound with EGF. We developed an effective single-molecule approach to reveal the underlying mechanism. In Section II, we first illustrated the principle of an energetic model and provided some simulation results for the methodology; and then in Section III, some experimental evidences of single-molecule trajectories were given to verify the methodology. More... |
II. Energetic Modeling of Dynamic Regulation on Receptor Complexes by Actin Corrals and Lipid Raft DomainsThis section presents a rigorous formulation of data visualization scheme that captures dynamic interactions of receptors at the single-molecule level and yields deep insight into the functional architecture of both the diffusing EGFR molecules and their local cellular environment. To faithfully transduce a signal that varies in space and time, a living cell faces the problem of optimally placing a collection of distributed and mobile receptors by balancing two opposing objectives. The first objective is the need to locally assemble sensors to reduce estimation noise and the second is the need to spread them to reduce spatial error. G. Iyengara and M. Rao recently provided a fresh perspective on the optimization problem based on information theory. They arrived two optimal strategies in the context of biology: The signaling protein receptors on the surface of live cells can be organized into a stationary lattice architecture or into a mobile active clustering depending on the local density of receptors and the incoming signal characteristics. However, the real situation is much more complex because living eukaryotic cells are highly heterogeneous and stochastic dynamic. Lipid nanodomains (lipid rafts), which are rich in saturated lipid and cholesterol, can be formed spontaneously. It had been known that lipid raft domains also contain several kinds of actin-anchored signaling receptor proteins. Furthermore, phosphoinositides, the widely noted actin regulator that plays a fundamental part in controlling membrane-cytosol interfaces, can directly interact with those actin-anchored proteins and induce an aggregation of actin filaments underneath the lipid raft domains. The local density increases of actin filaments serve as nucleation sites for the formation of stable lipid domains. There exists a correlation between the formation dynamics of lipid rafts and the remodeling of actin network. The correlated dynamics could be imposed on the diffusive behaviors of actin-binding membrane proteins. Therefore, Kusumi, et al. proposed a cooperative action model that involves a hierarchical structure of actin skeleton-induced membrane compartments, lipid raft domains and dynamic protein complexes. However to verify the underlying processes are energetically favorable, it is important to develop an energetic model based on fundamental laws. The model may also be useful to help the retrieval of important information from single-molecule trajectories. Here we integrated the generalized Langevin equation with the Cahn-Hilliard equation into a unified formalism. The resulting energetic model involves a hierarchical structure of actin corrals, lipid raft domains, and dynamic receptor proteins. Simulation results are presented to elaborate the confinement effects on the diffusion of receptors from actin corrals and lipid raft domains. Single-molecule tracking data acquired on live He-La cells verifies the simulation results and the mechanism that controls the diffusion of single-molecule receptors is clarified. I. Model Description The schematic shown in Fig. 1 illustrates the basic concept of our theory. The model incorporates the dynamic segregation process of lipids induced by a receptor protein. Furthermore, we assumed that the lipid raft domains can follow the diffusive motion of actin-binding proteins. Thus, there exist a correlation between the formation dynamics of lipid raft domains and actin network. 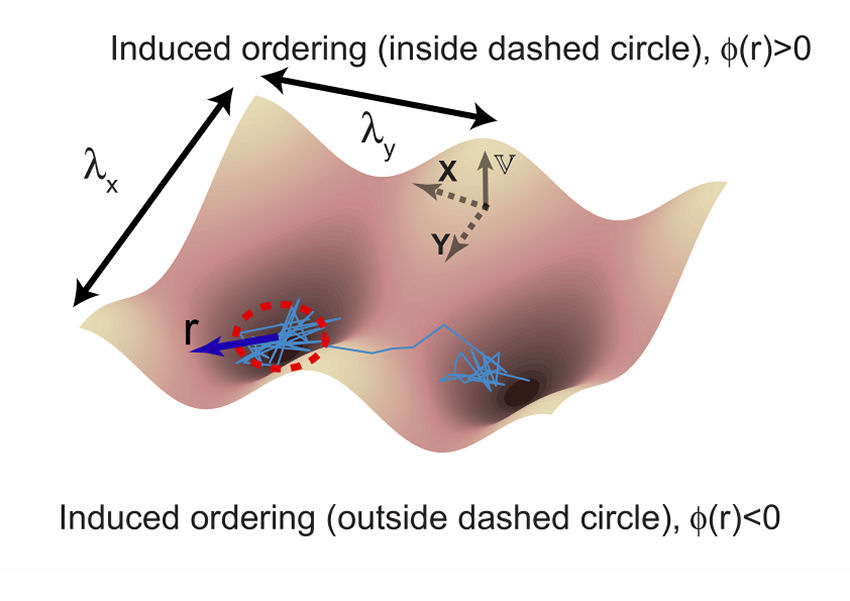
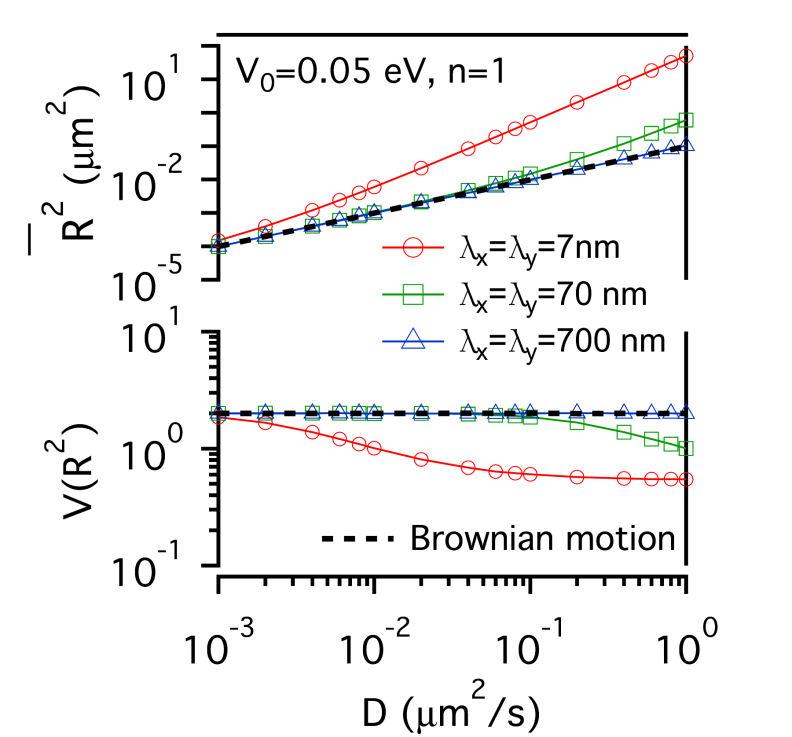
FIG.1: Schematic showing the model that involves the structure of actin skeleton-induced membrane compartments, lipid raft domains and dynamic protein complexes. The actin skeleton is modeled with a potential (\({\mathbb{V}_0}\)) and the length scales (\({\lambda _x}\) and \({\lambda _y}\)). The lipid raft domain (marked by red color) has a different lipid composition (\(\phi (r)\)>0) than that of non-raft area (\(\phi (r)\)<0) (marked by blue). The diffusion of a single-molecule receptor protein in the plasma membrane of the cell was simulated with the generalized Langevin equation, \(m\gamma \,{\partial _t}{\vec x_k} = - {\nabla _k}(V + F) + {\vec f_k} = - U + {\vec f_k}\), where subindex k represents the k-th molecule at the position \({\vec x_k}\). The frictional parameter \(\gamma \) is relevant to the diffusion coefficient D with \(m\gamma = {k_B}T/D\). The total driving force acting on the diffusive protein is expressed as -U. The fluctuation force \({\vec f_k}\) behaves like a Gaussian white noise with zero mean. Assuming that lipid domains are formed by spatiotemporally regulated lipid-dependent segregation, then the order parameter \(\phi (r) \) of the lipid is governed by the Cahn-Hilliard equation \({\partial _t}\phi (r) = D{\nabla ^2}[{\partial _\phi }F]\), where F denotes the Ginzburg-Landau functional of the lipid-lipid and protein-lipid interaction energy densities, and can be expressed as \(F = \int {\left[ {\frac{1}{2}\alpha \phi {{ (r)}^2} + \frac{1}{4}\beta \phi {{(r)}^4} + \frac{1}{2}\chi {{\left| {\nabla \phi (r)} \right|}^2} - \phi (r){S_p}(r)} \right]dA} \). The Cahn-Hilliard equation is a coarse-grained version of Brownian-like diffusion. For a diffusive protein inside a lipid raft domain and can anchor to an actin filament, a free energy reduction can be yielded by setting \({S_p}(r) = 1\) with \(\phi (r) > 0\) in the lipid-raft domain and \(\phi (r) < 0\) in the non-raft area. Assuming the fluctuation force to follow the Wiener process \(d{W_t}\), we can derive an equation for the square displacement \(d{\vec x_k}^2 = - 2\frac{{UD }}{{{ k_B}T}}{\vec x_k}dt + 2Ddt + 2\sqrt {2D} {\vec x_k}d{W_t}\) by applying the stochastic chain rule. From the equation we can derive the mean-square and the variance of square displacement as \({\left( {\overline {d{{\vec x}_k}^2} } \right)^2} = {\left( { - 2E\left[ {\frac{{UD}}{{{k_B}T}}{{\vec x}_k}} \right]\Delta t + 2D\Delta t} \right)^2}\) and \(Var\left[ {d{{\vec x}_k}^2} \right] = 8D{\left( {\overline {{{\vec x}_k}} } \right)^2}\Delta t + 4Var\left[ {\frac{{UD}}{{{k_B}T}}{{\vec x}_k}} \right]{(\Delta t)^2}\), where Var and E denote the variance and expectation value. By using the local mean-square displacement (MSD) \(\overline {{R_k}^2(t)} = \overline {d{{\vec x}_k}^2(t)} \) we can define a normalized variance of the square displacement \(V({R^2}) = {\mathop{\rm Var}\nolimits} ({R^2})/{(\overline {{R^2}} )^2}\) to measure the relative influence of a deterministic force to that of the stochastic force. We used a periodic potential \(\mathbb{V} = {\mathbb{V}_0}co{s^n}[\pi (\frac{{{x_k }}}{{{\lambda _x}}} + \frac{{{y_k}}}{{{\lambda _y}}})]co{s^n}[\pi (\frac{{{x_k}}}{{{\lambda _x}}} - \frac{{{y_k}}}{{{\lambda _y}}})]\) to model the action of actin filaments on the receptor protein. For simplicity, we first considered the extreme case with \(n \gg 1\). The normalized variance can be simplified to be \(V({R^2}) = \left\{ {\begin{array}{*{20}{c}}{2\;\;{\mkern 1mu} {\rm{Brownian}}\;{\rm{motion}}}\\{\frac{2}{{{{(1 - \frac{{{\mathbb{V}_0}\pi }}{{{k_B}T}})}^2}}}\;\;{\mkern 1mu} n \gg 1}\end{array}} \right.\) , showing that for molecules under free diffusion (i.e., \(\mathbb{U} = 0\)), \(V({R^2})\) has a constant value of 2. As molecules diffuse under confinement of actin corral, \(V({R^2})\) increases monotonically from 2 with the confinement strength. In the case of the deterministic force much larger than the fluctuation force, \(V({R^2})\) decreases monotonically as the deterministic force increases. A critical region lies in the between where \(V({R^2})\) can have a value much larger than 2. Thus, the plot of \(V({R^2})\) versus \(\overline {{ R^2}(t)} \) carries useful information about local environment changes of receptors on live cells. II. Results A. Confinement effect of receptor protein by actin corrals We first presented the simulation results of the diffusive receptor proteins with different potential amplitude, potential profile, and domain sizes of actin corral. Fig. 2 gives a glimpe of the simulation results, where the local MSD with a sampling period of \(\tau \) and the normalized variance \(V({R^2})\) from the simulated single-moelcule trajectories were calculated as a function of diffusion coefficient D. At weak confinement strength, \(\overline {{R^2}(t)} \)-D follows closely the line of Brownian diffusion, which has a slope of 4\(\tau \). Only those fast species with \(\overline {{R^2}(t)} \) larger than the confined area can experience the confinement potential of actin corral. That causes \(\overline {{R^2}(t)} \) to deviate from the line of free Brownian motion. The resulting slope increases with (\({\mathbb{V}_0}\), yielding an effective diffusion coefficient \({D_{eff }} = \overline {{R^2}} /D\) for the faster species. The slope of \(\overline {{ R^2}(t)} \)-D does not change with potential profile index n. However, \(V({R^2})\) levels off at sufficiently fast diffusion to different values that sensitively depend on n. This saturation behavior can be understood as follows: For n=5, the proportionality of \({\mathop{\rm Var}\nolimits} ({R^2})\)-D is larger than that of \(\overline {{R^2}(t)} \)-D, causing the normalized variance to level off at a higher value. For n=1, the proportionality of \({\mathop{\rm Var}\nolimits} ({R^2})\)-D is smaller than that of \(\overline {{R^2}(t)} \)-D, which causes the normalized \(V({R^2})\) to saturate at a level lower than 2. By summarizing the simulation results, the level-off values of \(V({R^2})\) depend sensitively on the confinement profile and the D value where \(V({R^2})\) deviates from 2 depends on \({\mathbb{V}_0}\). (a)
 ...(b) ...(b)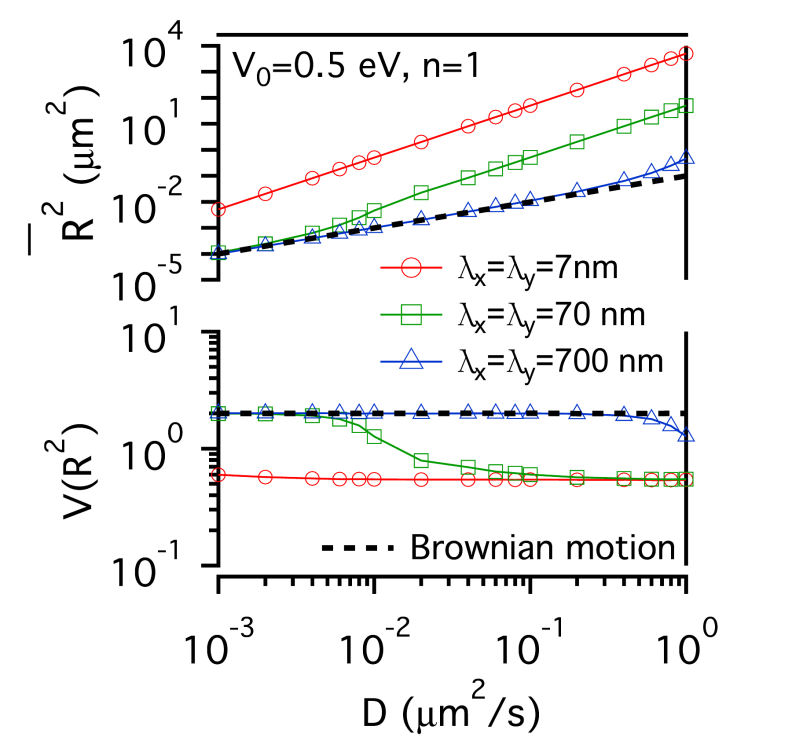
(c) 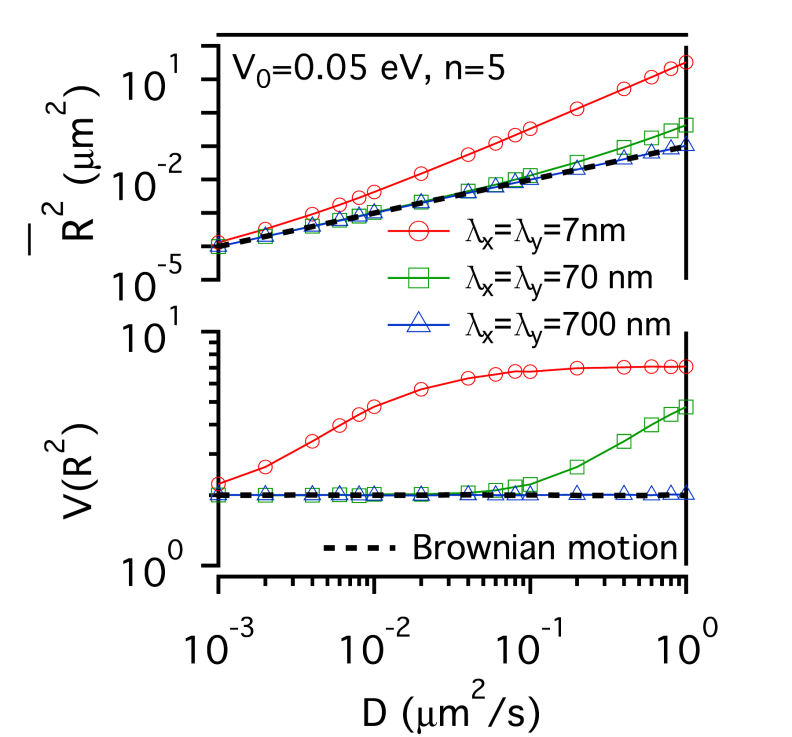 ...(d) ...(d)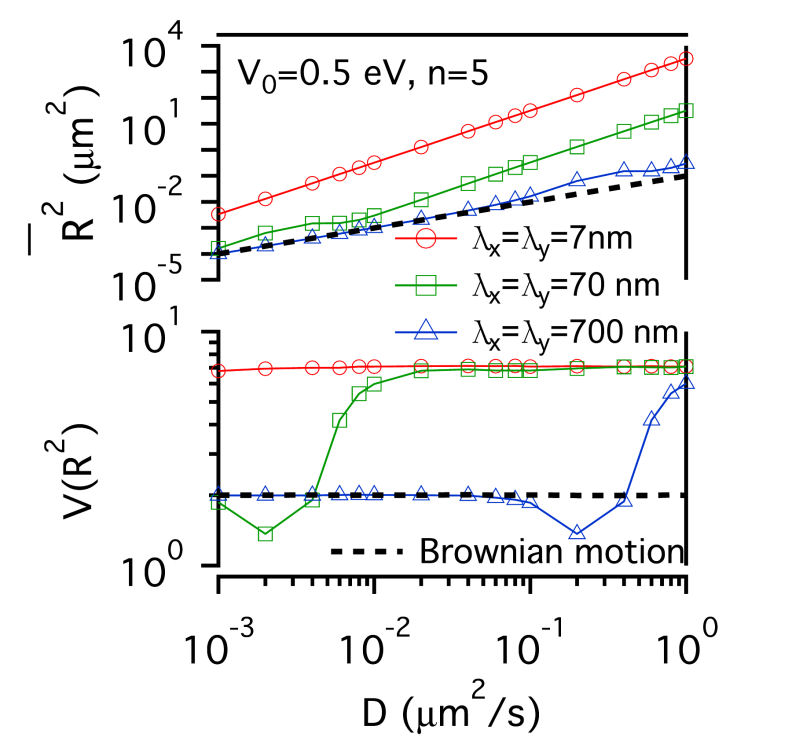
FIG. 2: \(\overline {{R^2}(t)} \)-D and \(V({R^2})\)-D of single-molecule receptors under (a and c) weak (\({\mathbb{V}_0}\)=0.05 eV) and (b and d) strong confinement potential (\({\mathbb{V}_0}\)=0.5 eV) with different potential profiles (n=1, 5) on three different actin domain sizes (\({\lambda _x} = {\lambda _y}\)=7 nm (red open circles), 70 nm (green open squares), and 700 nm (blue open triangles). B. Influence of lipid raft domain on the diffusion of receptor protein When a receptor molecule moves in a lipid environment, it can control the structuring of its surrounding lipid molecules via the protein-lipid interaction. To simulate this restructuring process, we prepared an initial homogeneous lipid environment with 40% raft lipids and 60% non-raft lipids (\({\phi _0}\)=-0.2), 60% raft lipids and 40% non-raft lipids (\({\phi _0}\)=0.2), and 70% raft lipids and 30% non-raft lipids (\({\phi _0}\)=0.4), respectively. Fig. 3 shows that the induced lipid raft domain raises \(\overline {{R^2}(t)} \) of receptors in the entire simulation range of D, and results in higher \(\overline {{R^2}(t)} \)-D slope. The increased slope does not depend on the initial lipid composition. In contrast, \(V({R^2})\) of receptor confined in a lipid raft domain decreases monotonically with increasing D. Due to the protein-lipid interaction, the receptor protein induces an increased ordering of surrounding raft lipid molecules. The protein and the surrounding lipid ordering \(\phi (r)\) can be viewed as a dressed protein. The faster the protein diffusion is, the larger the dressing effect has. This leads to \({\mathop{\rm Var}\nolimits} ({R^2})\) a weaker function of D than that of \(\overline {{R^2}(t)} \), rendering \(V({R^2})\) to decrease monotonically with increasing D. 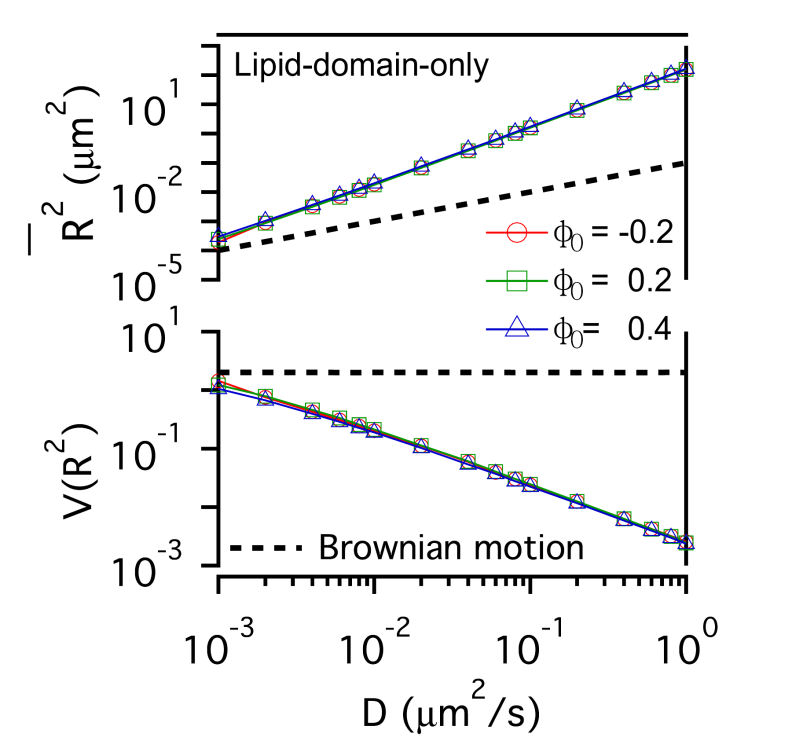
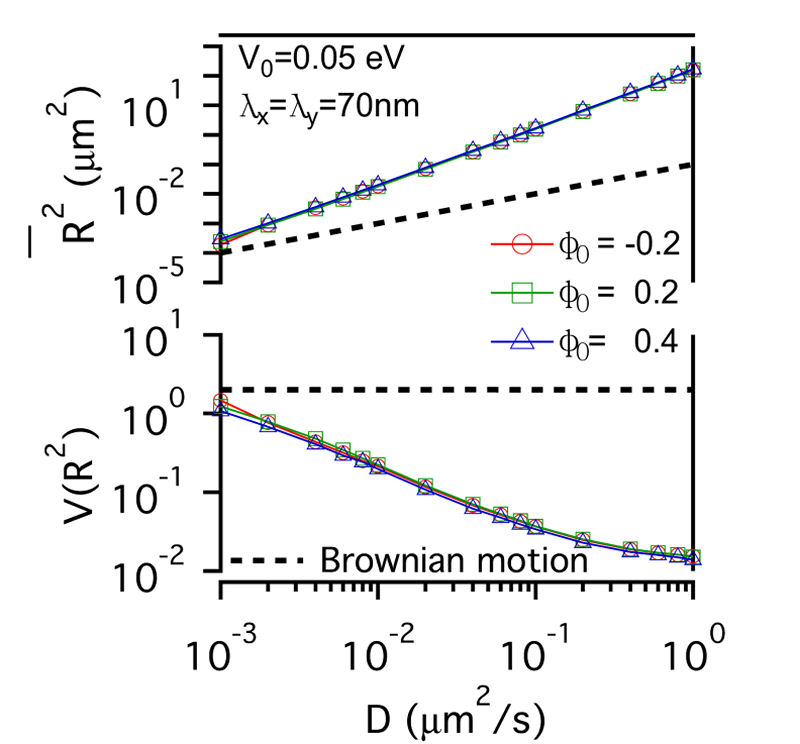
FIG. 3: The confinement effect of lipid raft domain on \(\overline {{R^2}(t)} \)-D and \(V({R^2})\)-D of single-molecule receptors. Three different initial lipid compositions \({\phi _0}\)=-0.2 (red open circles), 0.2 (green open squares), and 0.4 (blue open triangles) were prepared for this simulation. C. Influences on the diffusion of receptor proteins from both actin corrals and lipid raft domains There is a subtle difference between the confinement effects from actin corrals and from lipid raft domains. The influence of lipid raft domains on the diffusion of receptor proteins originates from an induced ordering of lipid molecules by the protein, yielding a dressing effect on the protein. In contrast, an analytic potential was used to describe the interaction between actin filaments and the confined protein. The force field experienced by the protein depends on the protein's position, which is stochastic in nature. Thus, it is interesting to investigate how \(\overline {{R^2}(t)} \) and \(V({R^2})\) of single-molecule trajectories are affected by the combined effects from actin corrals and lipid raft domains. The influences from lipid domains and actin corrals with two different potential profiles (n=1 and n=5) were presented in Fig. 4. Fig. 4(a) and Fig. 4(d) reveal the effect of weak actin confinement, clearly showing the influence on \(\overline {{R^2}(t)} \) and \(V({R^2})\) to be dominated by lipid domains. The curves of \(V({R^2})\)-D begin to level off at D=0.2 \(\mu {m^2}/s\). Fig. 4(b) and Fig. 4(e) show the results with medium actin confinement strength. For the case with n=1, the confinement force field is nonnegligible at the center of actin confinement domain. At this case, \(V({R^2})\) remains close to 2 as 0.001 \(\mu {m^2}/s\)<D<0.006 \(\mu {m^2}/s\), indicating that the confinement effects from actin corrals and lipid domains have opposite effect on \(V({R^2})\). When D>0.006 \(\mu {m^2}/s\), \(V({R^2})\) decreases from 2 and then levels off to a value, which depends on the actin confinement strength. For n=5, the confinement force field is negligible at the center of actin corral. The variation of \(V({R^2})\) is dominated by the lipid raft domains and decreases from 2 as D>0.001 \(\mu {m^2}/s\). At D=0.04 \(\mu {m^2}/s\), it then levels off due to the actin confinement effect. For the case with strong actin confinement shown in Fig. 6(c) and Fig. 6(f), the \(\overline {{R^2}(t)} \)-D curves have the same slope as the previous cases but shift upward. For n=1, \(V({R^2})\) decreases from 2 as D>0.001 \(\mu {m^2}/s\) and then levels off at D>0.01 \(\mu {m^2}/s\). For n=5, the confinement force is so strong that \(V({R^2})\) becomes a constant that reflects the actin confinement strength. (a)
 (b) (b)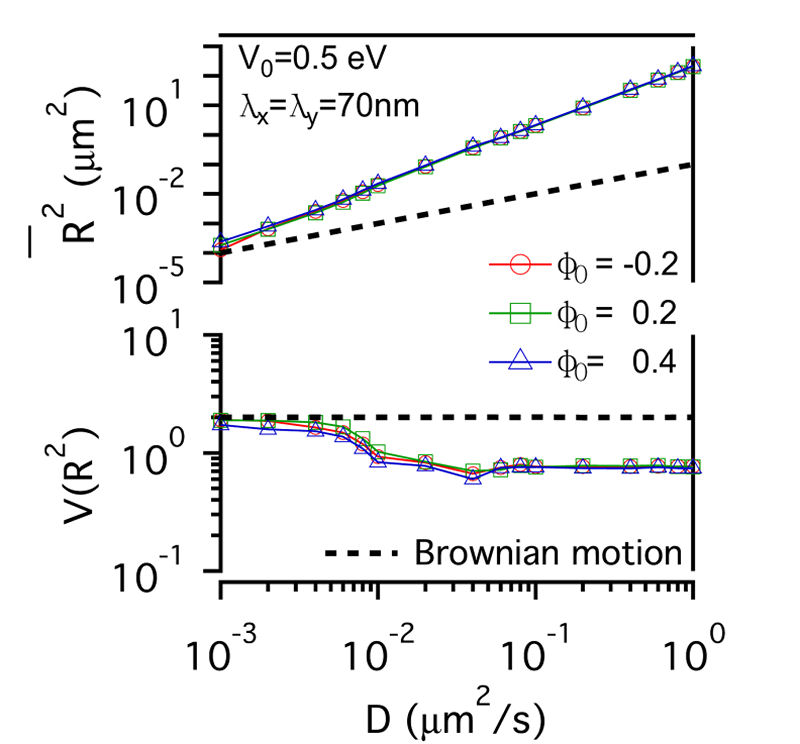 (c) (c)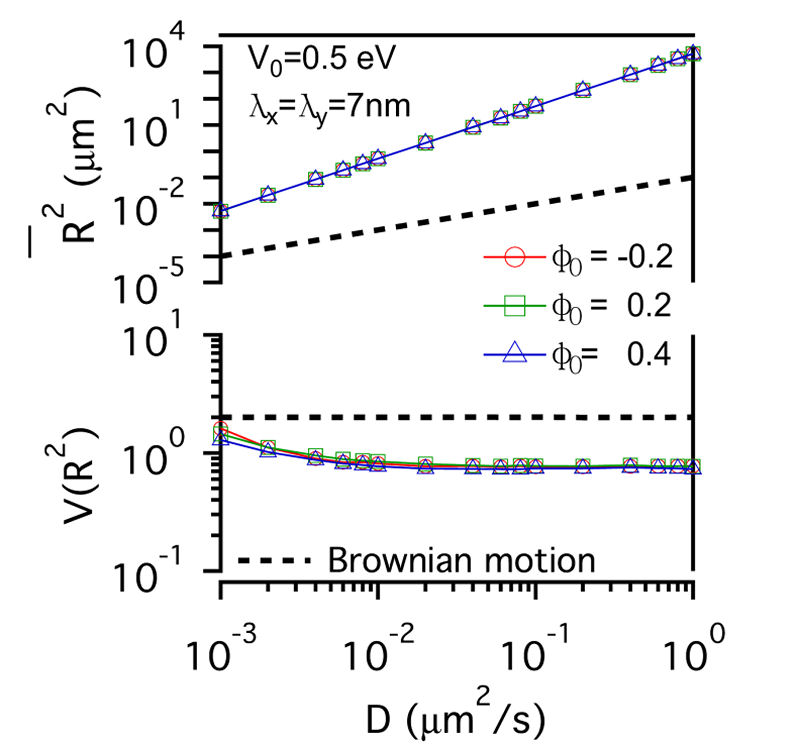
(d) 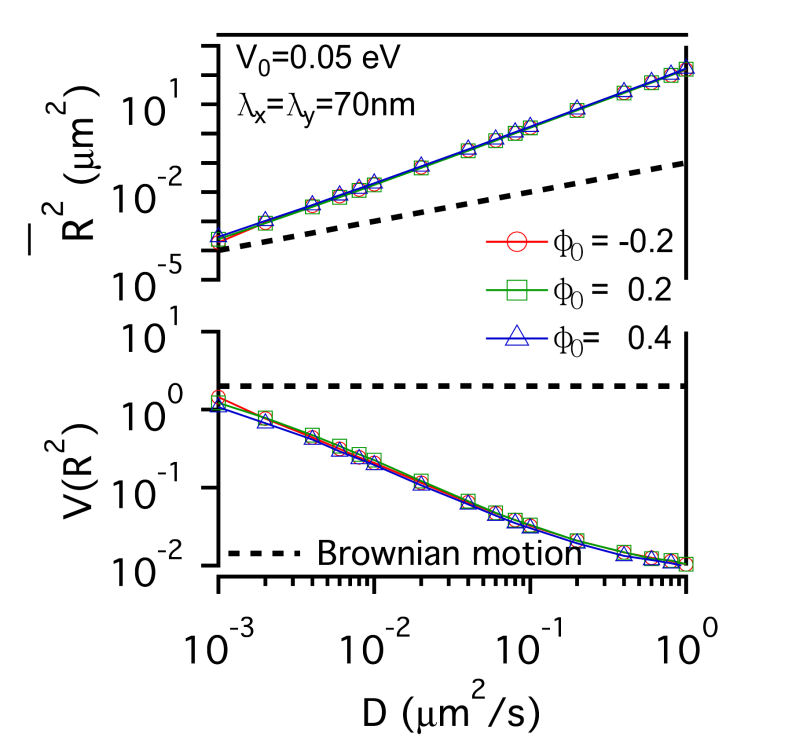 (e) (e)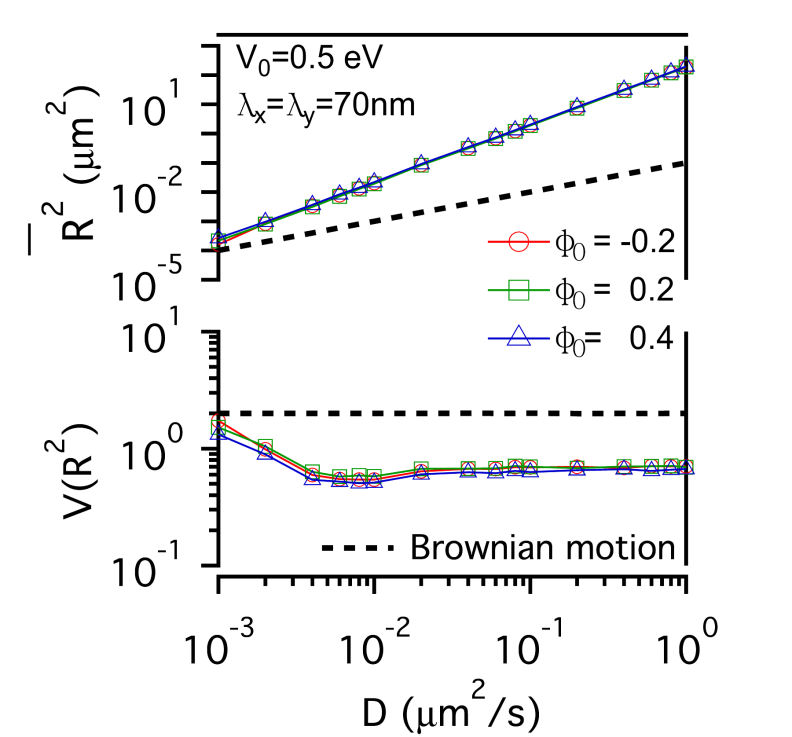 (f) (f)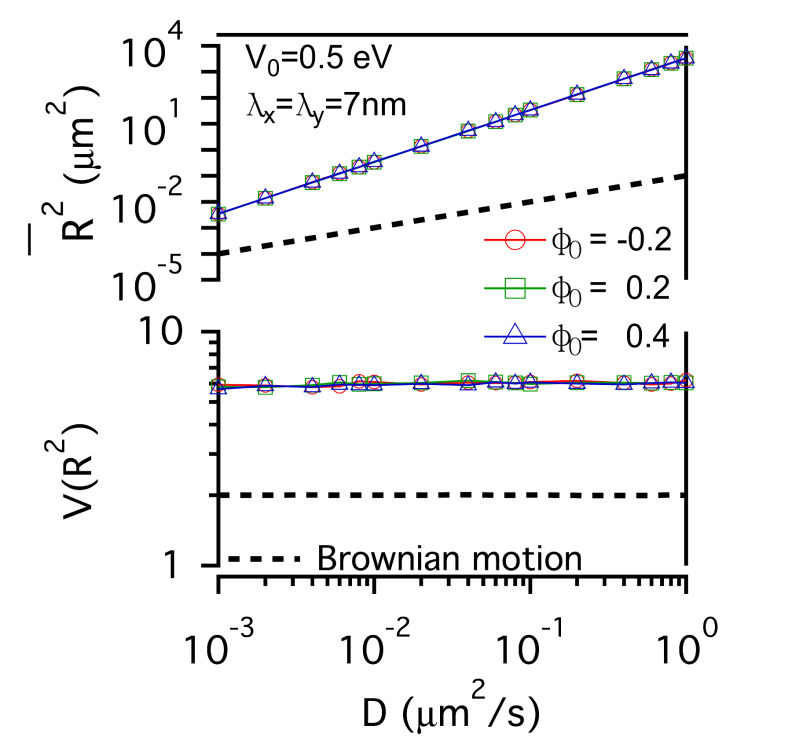
FIG. 4: Simulation results on the confinement influences from both lipid raft domains with different initial lipid compositions (\({\phi _0}\)=-0.2, 0.2 , 0.4) and actin corrals: (a) weak (\({\mathbb{V}_0}\)= 0.05eV, \({\lambda _x} = {\lambda _y}\)=70 nm); (b) medium (\({\mathbb{V}_0}\)=0.5 eV; \({\lambda _x} = {\lambda _y}\)=70 nm); and (c) strong (\({\mathbb{V}_0}\)=0.5 eV; \({\lambda _x} = {\lambda _y}\)=7 nm) confinement strength. In (a), (b), (c), the potential profile index is n=1; in (d), (e), (f), n=5. In summary, we developed an energetic model that captures both statistics of single-molecule trajectories and complex structures of plasma membranes of live cells. Simulation results on the diffusive trajectories of receptor proteins under varying confinements from actin corrals and lipid raft domains were presented in a plot of normalized variance \(V({R^2})\) versus \(\overline {{R^2}(t)} \). An attractive feature of this data visualization scheme is that when a molecule repetitively visits a membrane domain, the characteristic \(\overline {{R^2}(t)} \) and \(V({R^2})\) of the domain will be imposed on the trajectory; this yields a peak feature at the corresponding position on the plot. Our energetic model can provide a useful platform for further development to improve our understanding of how the mobile active clustering process of receptors and membrane structure regulates signal transduction. If you have any feedback you like to share, I will appreciate to hear about it. Please hit |
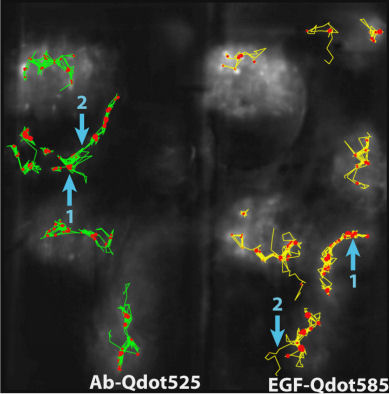
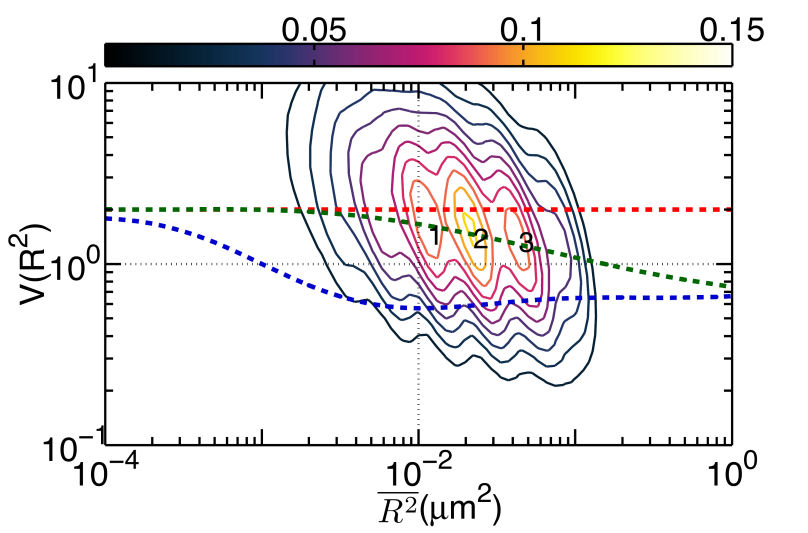
III. Unraveling the Impact of Lipid Domains on the Dimerization Processes of EGFRs of Live CellsThis section presents the experimental verification of the model that reveals the regulation effects of EGFR dimerization from the membrane structure of live cell. It remains a challenge to study cellular events in a live cell as living cells are highly heterogeneous and stochastic dynamic at the single-molecule level. To improve our understanding of the functional architecture of both the diffusing EGFR molecules and their local cellular environment, we tagged EGFRs on the plasma membranes of living He-La cells with cyanine 3 fluorophore (Ab-Cy3), as illustrated in Fig. 2 of Sec 1. The labeled live cells were imaged at 100 ms time intervals to yield single-molecule tracks with typical durations of 50 s. A. Ligand binding causes EGFR to move into lipid domains We applied the above technique to analyze the experimental single-molecule tracks of unliganded Qdot525-Ab-EGFR of live He-La cells at rest. The localization accuracy of our single-molecule optical apparatus was about 40 nm, implying an accuracy of 0.002 \(\mu {m^2}\) for \(\overline {{R^2}(t)} \) determination. Among the three peaks, labeled 1, 2, and 3 in Fig. 1(a), the peak 2 was the most highly populated and had the most stable state given that the forward rate constant was \({k_f}(2 \to 3)\)=3.7 \({s^{ - 1 }}\), which was lower than that of the other forward kinetic process \({k_f}(1 \to 3)\)=10.2 \({s^{ - 1}}\) and the backward rate constants \({k_b}(3 \to 1)\)=32.4 \({s^{ - 1}}\) and \({k_b}(3 \to 2)\)=39.3 \({s^{ - 1}}\). The three peaks were located at the \((\overline {{R^2}} ,V({R^2}))\) coordinates of (0.01, 1.45), (0.02, 1.39), and (0.04, 1.33), respectively. The simulated curves shown in Fig. 1 for molecules under free Brownian motion (red dash line), including the confinement effect from actin corrals only (green dash line), or both the actin corrals and lipid domains (blue dash curves), were included for comparison. The peak positions of the three states fell on the curve of the actin confinement, indicating that these unliganded receptor molecules were not free diffusers, but instead confined by actin corrals.
(a)
 (b) (b)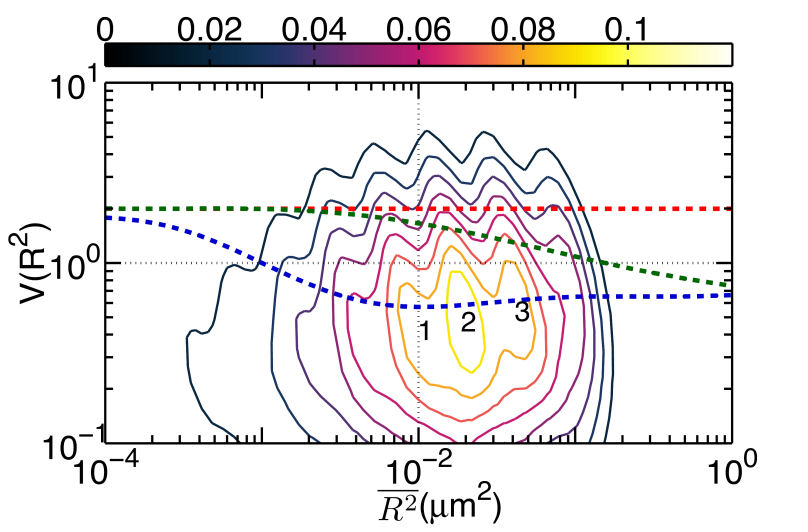 (c) (c)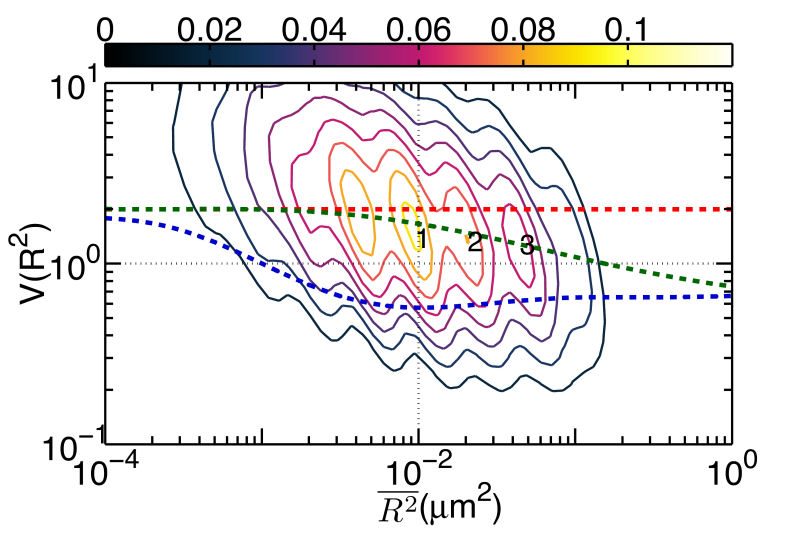
FIG. 1: (a) The plot of \(V({R^2}) - \overline {{R^2}} \) for unliganded Qdot525-Ab-EGFR on live He-La cells at rest. Simulated curves of the peak positions for receptor molecules under free Brownian motion (red dash line), diffusive motion with the confinement from actin corrals alone (green dash line), or both the actin corrals and lipid raft domains (blue dash line) are included for comparison. The same plot is shown for liganded Qdot585-EGF-EGFR in (b) EGF-activated cells, and (c) activated cells pretreated with nystatin. With the EGFR at rest as the control, we further examined the diffusion kinetics of liganded Qdot585-EGF-EGFR. Figures 1(b) and 1(c) show the \(V({R^2}) - \overline {{R^2}} \) plot of the liganded EGFR on activated native cells and nystatin-pretreated cells. In Fig. 1(b), three peaks were found to locate at (0.01, 0.42), (0.02, 0.47), and (0.04, 0.54) with associated forward transition rate constants of \({k_f}(1 \to 3)\)=4.8 \({s^{ - 1}}\) and \({k_f}(2 \to 3)\)=5.1 \({s^{ - 1}}\). These three peak positions agreed better with the model that includes the confinement effects of both actin corrals and lipid domains. Pretreating the cells with nystatin reduced the forward rate constants to \({k_f}(1 \to 3)\)=3.4 \({s^{ - 1}}\) and \({k_f}(2 \to 3)\)=3.6 \({s^{ - 1}}\), which were similar to those of the unliganded EGFR at rest. Furthermore, the three peaks of Fig. 1(c), found at (0.01,1.39), (0.02, 1.33), and (0.04, 1.28), fell again on the curve of the actin-only confinement model, perhaps because unliganded EGFRs at rest are located outside the lipid domains. EGF binding caused the receptors to move into the lipid domains, but pretreatment of cells with nystatin sequesterd the membrane cholesterol and disrupted the lipid domains. This leads to local environmental changes in the ligand bound EGFR and reduced the rate constants of the diffusion kinetics. This interpretation is further supported by our observation that nystatin pretreatment did not alter the peak positions of unliganded EGFR on activated cells B. Correlation duration of dual EGFR molecules depending on their ligand occupancy When a receptor molecule moves past a nearby receptor molecule, it may experience an interaction force that then induces a correlated motion between the two receptor molecules. To analyze the correlated motion, we defined a parameter to more quantitatively reflect the degree of correlation: \(\begin{array}{c}\rho = {\rho _r} \times {\rho _\phi }\\ = \frac{{\sum\limits_k {({r_1}({t_k}) - {{\bar r}_1})} ({r_2}({t_k}) - {{\bar r}_2})}}{{\sqrt {\sum\limits_k {{{({r_1}({t_k}) - {{\bar r}_1})}^2}} } \sqrt {\sum\limits_k {{{ ({r_2}({t_k}) - {{\bar r}_2})}^2}} } }}\frac{{\sum\limits_k {({\phi _1}({t_k}) - {{\bar \phi }_1})({\phi _2}({t_k}) - {{\bar \phi }_2})} }}{{\sqrt {\sum\limits_k {{{({\phi _1}({t_k}) - {{\bar \phi }_1})}^2}} } \sqrt {\sum\limits_k {{{({\phi _2}({t_k}) - {{\bar \phi }_2})}^2}} } }}\end{array}\) , where \({r_i}\) is the magnitude of a displacement by molecule i, and \({\phi _i}\) is the corresponding angle of the displacement. The summations were taken over a time mesh along the single-molecule tracks. To retrieve the highly correlated segments from the single-molecule tracks, we set both \({\rho _r}\) and \({\rho _\phi }\) to be larger than 0.95 to achieve a degree of correlation higher than 0.9. By using the method, we were able to select the highly correlated segments from the tracks and to analyze the duration of the correlated motion. The results are presented in Fig. 2, revealing that prior to the formation of a dimer, the two EGFRs moved together with a high degree of correlation for about 2 s and then departed from each other. A fraction of the EGFR pairs moved correlatively for longer duration to form a dimer. For the dual ligand EGFR pairs, the duration could last as long as 20-30 s, whereas for the single ligand pairs the correlation duration was shortened to 10 s. 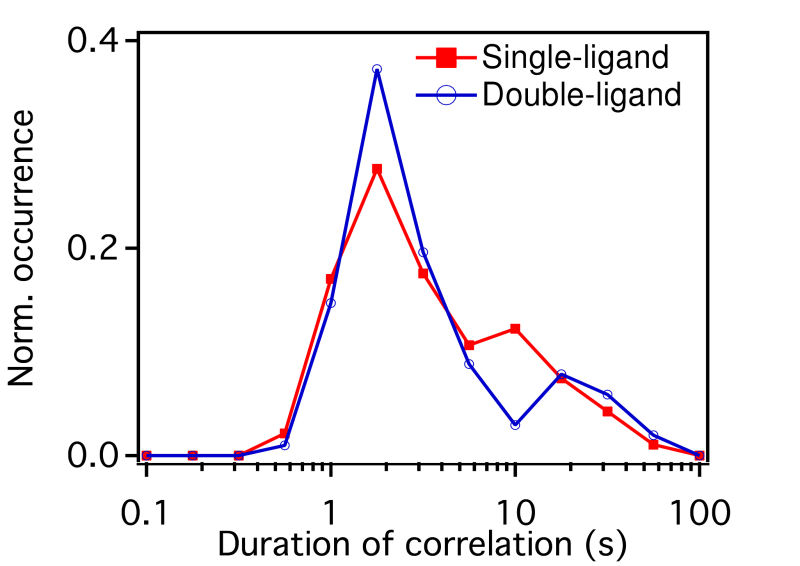
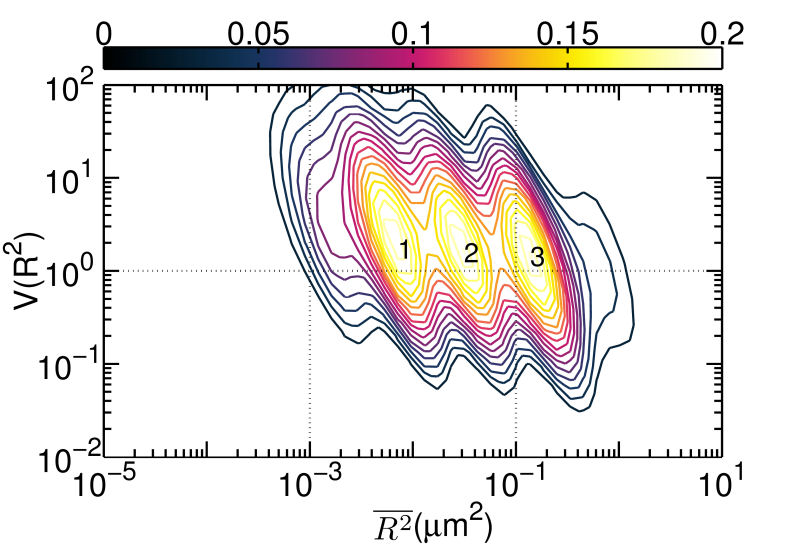
FIG. 2: Duration of correlated motion between the singly liganded EGFR pairs (red filled squares), and dual EGFRs with double ligand binding (blue open circles). C. Correlated motions of dual EGFR molecules revealing the liganded and unliganded species residing in different lipid environments As the receptors approached each other, their relative motion yielded insights into their interactions and the constraints imposed by membrane architecture. To unravel this important information, we plotted the \(V({R^2}) - \overline {{R^2}} \) of the correlated motion of unliganded Cy3-Ab-EGFR with liganded Ax488-EGF-EGFR. For comparison, the result of the unliganded EGFR molecules at rest is presented in Fig. 3(a), showing that EGFRs diffuse rapidly with the highest \(V({R^2})\) approaching 2. As an unliganded Cy3-Ab-EGFR moved correlatively with a nearby liganded Ax488-EGF-EGFR, the diffusion motility \(\overline {{R^2}} \) of state 1 decreased drastically to near \({10^{ - 3}}\), accompanied by a reduction of \(V({R^2})\) to 0.1 (See Fig. 3(b). It is interesting to note that the \(V({R^2}) - \overline {{R^2}} \) plot of the reverse case (Ax488-EGF-EGFR relative to Cy3-Ab-EGFR) differed slightly in \(\overline {{R^2}} \), as shown in Fig. 3(c). The resident time of Ax488-EGF-EGFR in state 2 became longer and the \(V({R^2})\) of both states (1 and 2) increased to 1, supporting that the liganded Ax488-EGF-EGFR and unliganded Cy3-Ab-EGFR resided in different lipid environments. (a)
 (b) (b)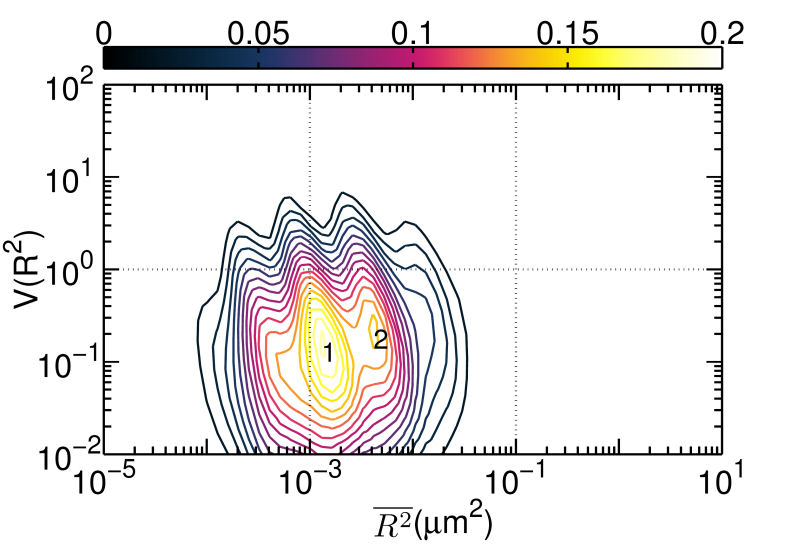 (c) (c)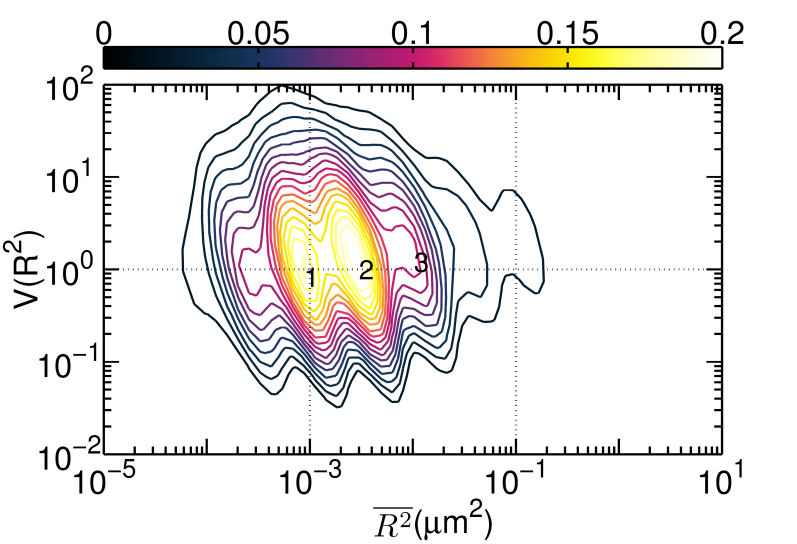
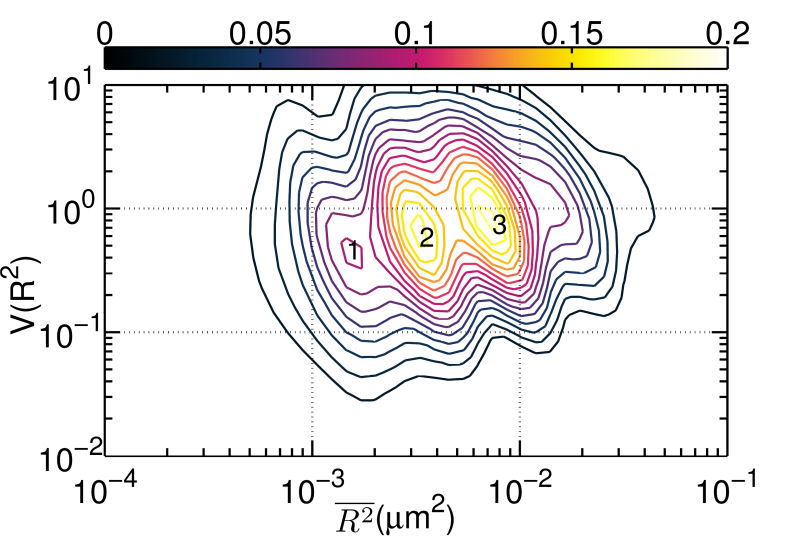
FIG. 3: \(V({R^2}) - \overline {{R^2}} \) plot of correlated motion of dual EGFRs with single ligand. (a) unliganded Cy3-Ab-EGFR on live He-La cells at rest as the control, (b) unliganded Cy3-Ab-EGFR correlatively moving with a nearby liganded Ax488-EGF-EGFR companion, and (c) liganded Ax488-EGF-EGFR correlatively moving with a nearby unliganded Cy3-Ab-EGFR. The \(V({R^2}) - \overline {{R^2}} \) plot of the correlated motion between two liganded Ax488-EGF-EGFRs is presented in Fig. 4(a). Comparing the plot to that shown in Fig. 3(c), the \(V({R^2})\) values of the two major states were found to decrease when the unliganged companion of Fig. 3(c) was replaced by liganded EGFR, perhaps because the lipid domains surrounding the two receptor molecules merge and yield a larger \(\mathbb{U}\) during the correlated motion. Pretreatment of the cells with nystatin (Fig. 4(b)) would disrupt the lipid nanodomains and decrease \(V({R^2})\) further, due to the stronger deterministic dimeric interaction experienced. This explanation is supported by our spatial separation data of the two liganded EGFRs in correlated motion presented in Fig. 4(c), showing that nystatin treatment shifted the distribution peak of the receptor separation from 150 nm to about 50 nm. (a)
 (b) (b)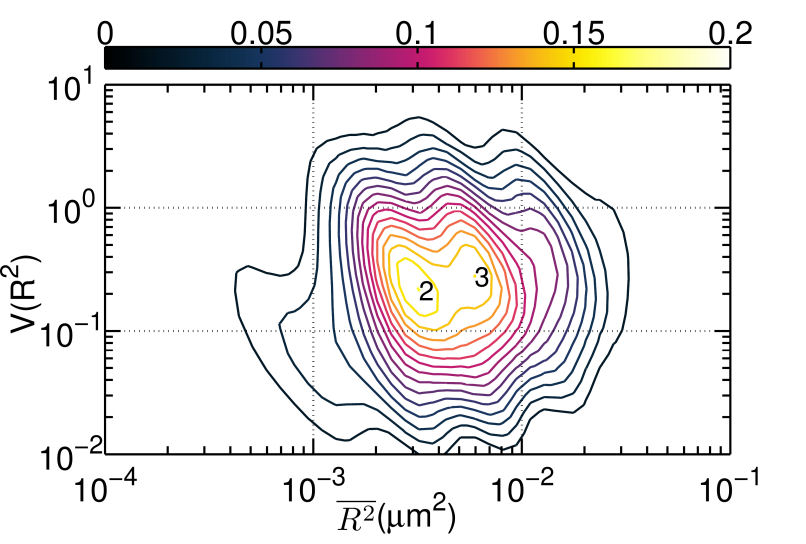
(c) 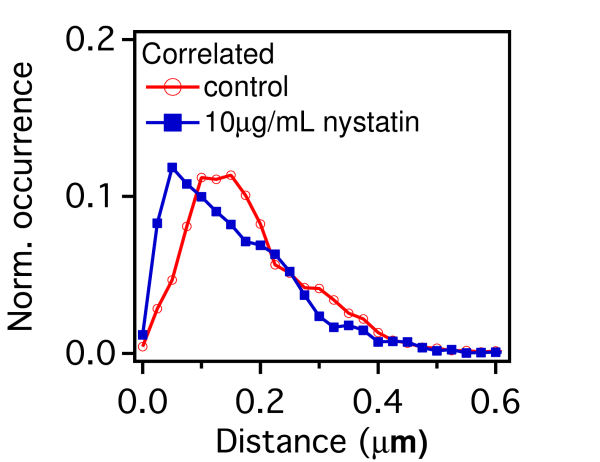 (d) (d)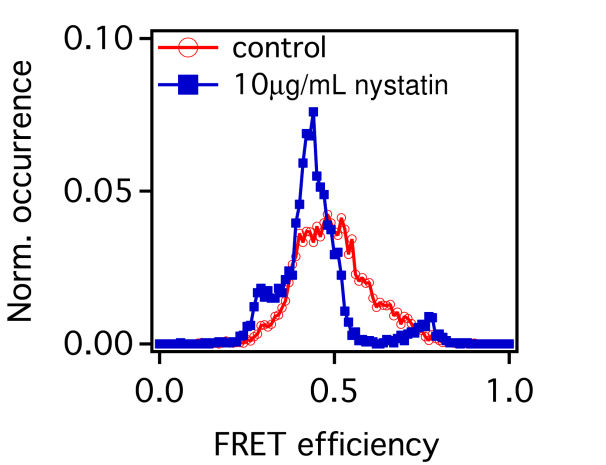
FIG. 4: \(V({R^2}) - \overline {{R^2}} \) plot of correlated motion of dual EGFRs with double ligands. (a) two liganded Ax488-EGF-EGFRs on live cells. (b) The same as (a) but on nystatin-pretreated cells. (c) Histogram of the relative distance between two bound ligands during the correlated motion of two Ax488-EGF-EGFRs. (d) Histogram of the FRET variation between Ax488-EGF-EGFR and Ax532-EGF-EGFR on activated live He-La cells (red open circles: native, blue solid squares: pretreated by nystatin) Thus, two liganded EGFRs in correlated motion can form a dimer. This can be verified with two-color single-molecule FRET measurements of Ax488-EGF-EGFR and Ax532-EGF-EGFR. The histogram of FRET efficiency between the labeled receptors is presented in Fig. 4(d). The measured FRET efficiency on live cells (red open circles) peaked at 0.5 with a tail extending up to 0.8, indicating that the distance between two bound ligands in EGFR dimers is fairly heterogeneous, which can be attributed to the different conformations of dimers in varying lipid domain sizes and lipid compositions. Pretreatment of the cells with nystatin renderd a FRET distribution to three groups, with a FRET efficiency centering at 0.3, 0.4, and 0.8, respectively. The highest FRET efficiency at 0.8 implies that without the constraint of lipid domains, the two liganded receptors in the dimers are allowed to close each other on nystatin-treated cells. Notice that the occurrence of FRET efficiency shall not be taken to represent the real population of dimer conformation because the highly nonlinear dependence of the FRET efficiency on distance at the two extreme ends. As a final remark, we like to point out that our results also agree well with previous theoretical and experimental studies. For example, G. Orr, et al. used single-molecule fluorescence imaging to track individual receptors and their dimerization partner and found that the diffusion pattern of both receptors can be altered by dwellings within lipid nanodomains. They concluded that upon ligand stimulation the association of the receptors with lipid rafts is crucial to promote their rapid interactions. In addition, A. Kusumi, et al. proposed a cooperative action that involves the hierarchical structure of actin skeleton-induced membrane compartments, lipid raft domains and dynamic protein complexes. Ligand stimulation of receptor proteins can increase the sizes and lifetimes of lipid raft domains. In summary, we discovered that after ligand binding, EGFR molecules can move into lipid domains, whereas unliganded species remain outside the lipid domains. The transition rates between different diffusion states of liganded EGFR molecules are regulated by the lipid domains of live cells. The lipid domains surrounding two liganded EGFRs can merge during their correlated motion. The conformation of the EGFRs in a dimer in a lipid domain exhibits a fairly heterogeneous distribution of distance between the two bound ligands. Our quantitative data analysis method captures dynamic receptor interactions at the single-molecule level, providing details that are often obscured in other methods. Because dimerization is a common mechanism for signal transduction, our approach can be applied to many other receptor systems to improve our understanding of how the dimerization process of receptors and membrane structure regulates signal transduction. If you have any feedback you like to share, I will appreciate to hear about it. Please hit |
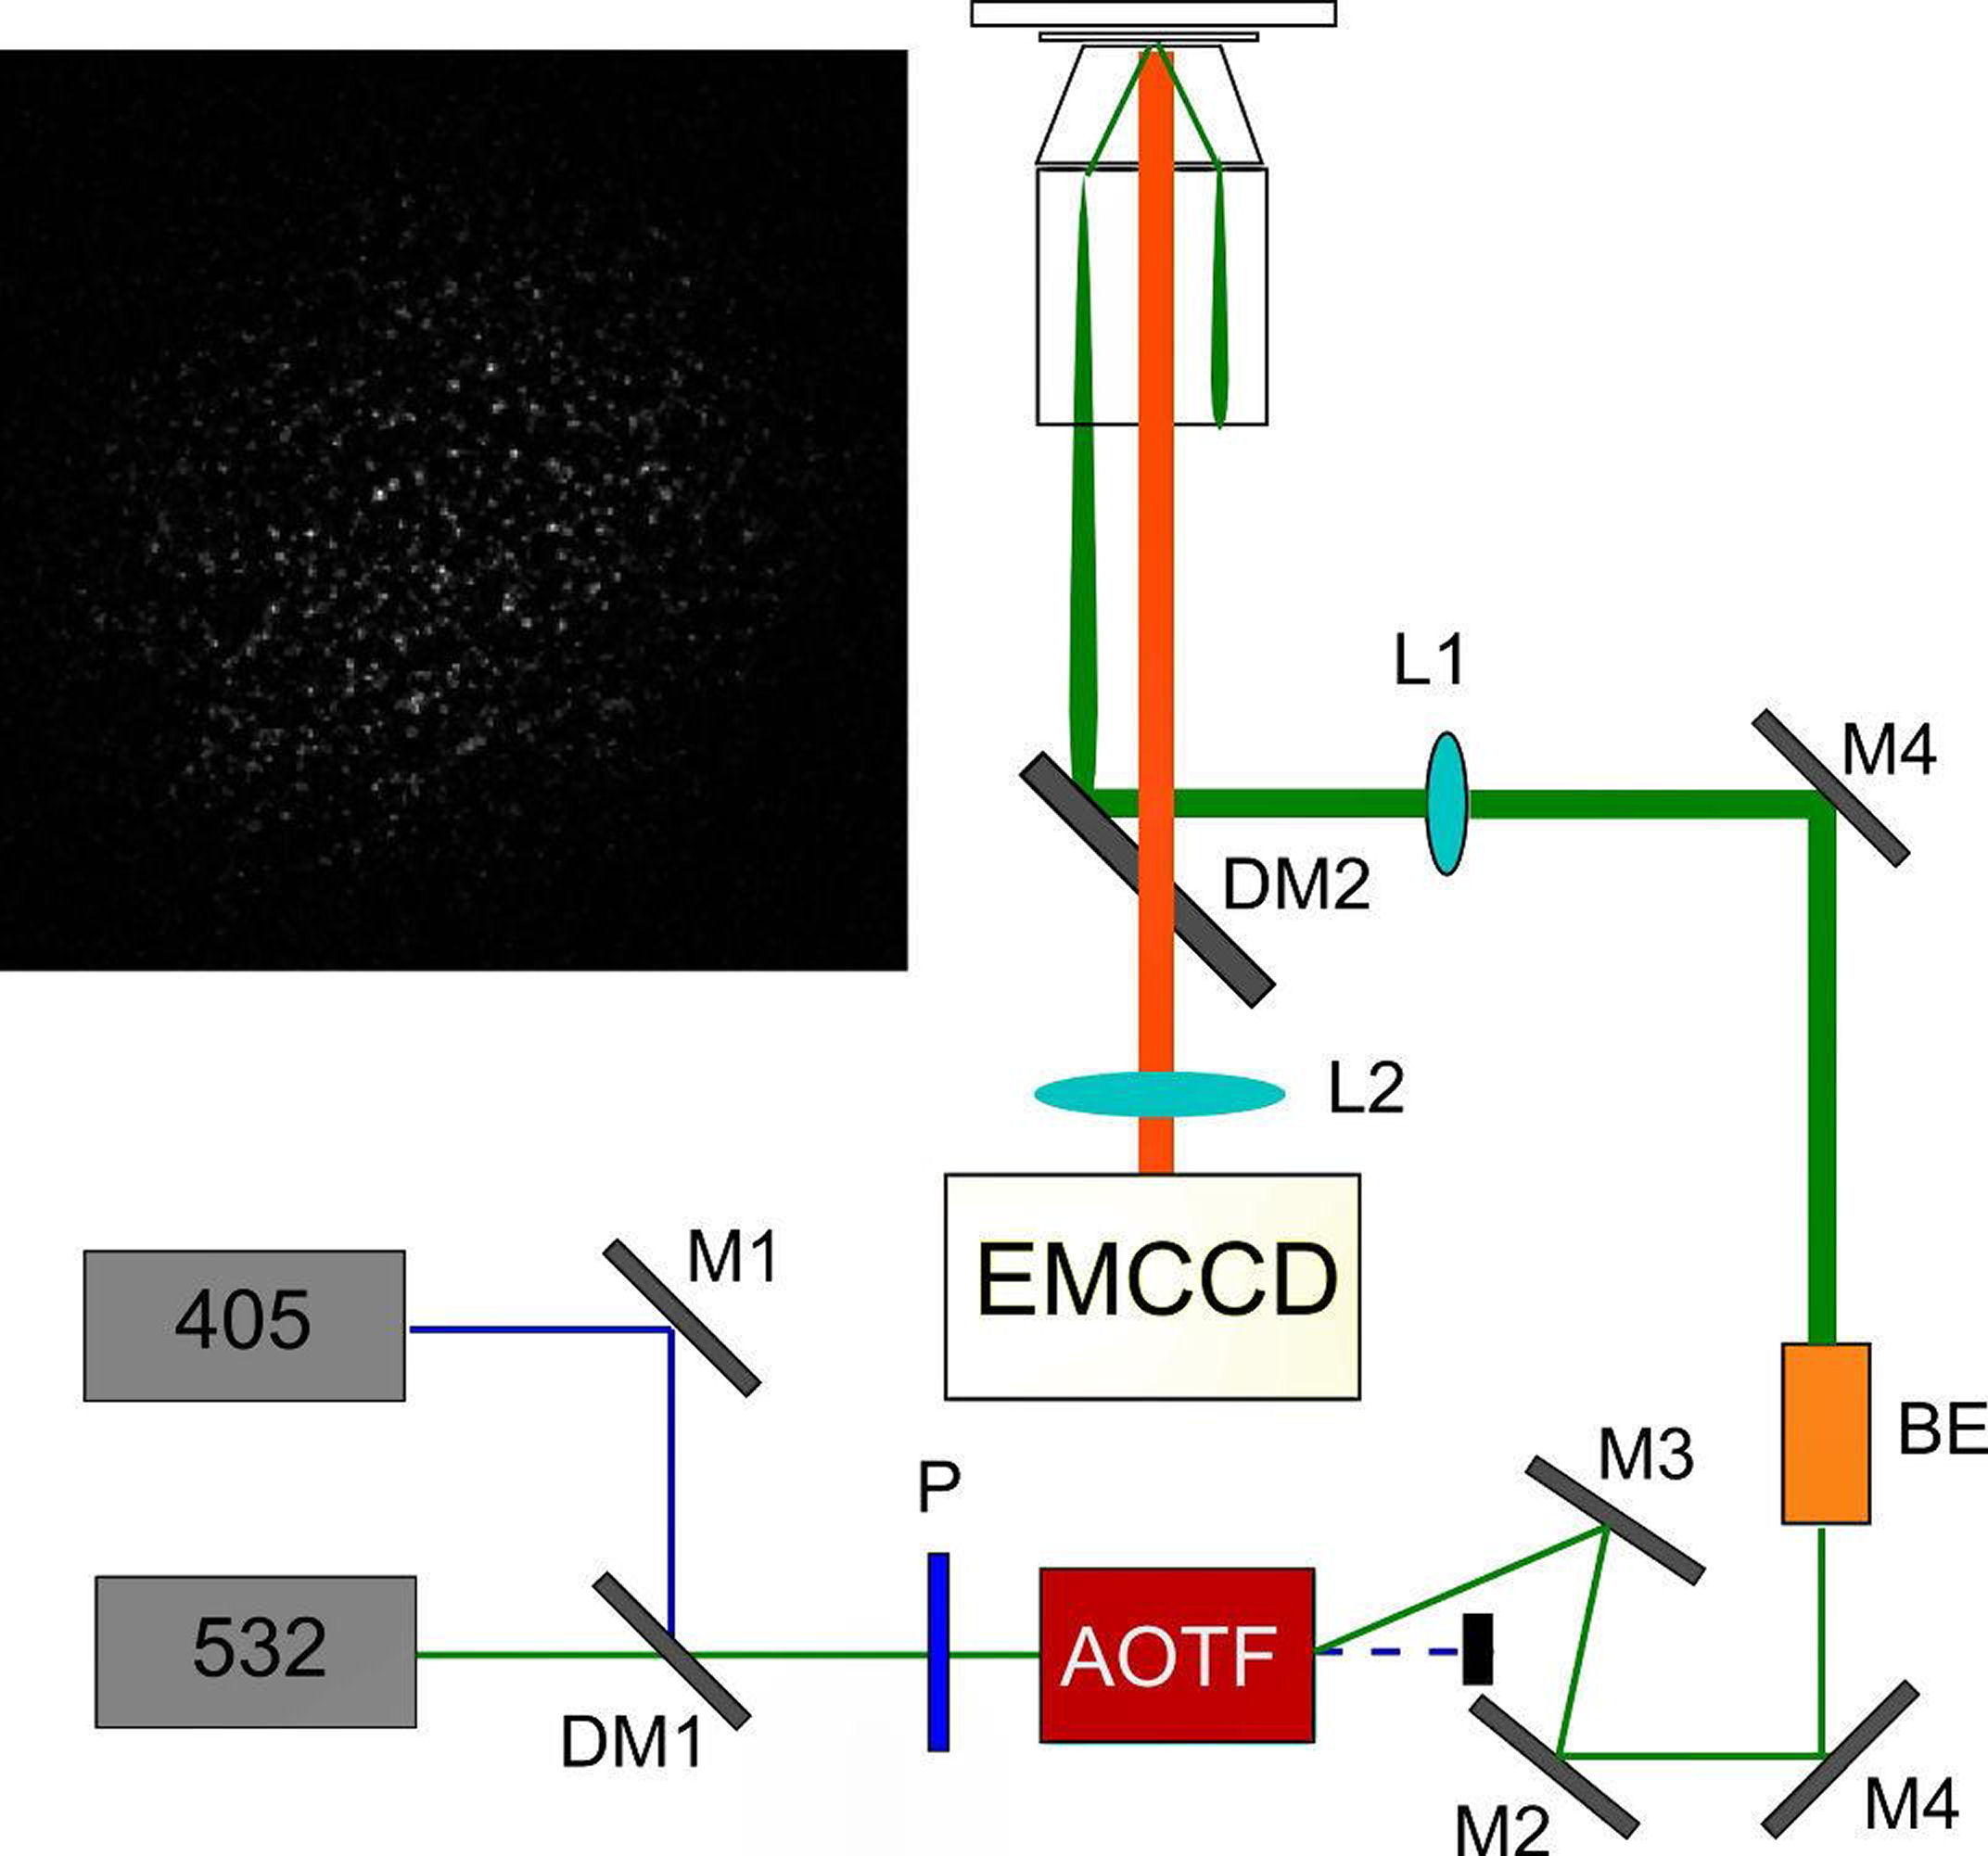
IV. Simultaneous Tracking of Location and Spectrum of Tagged EGFRs in Live CellsIn this section we demonstrate a technique that can localize EGFRs and at the same time reveal their microenvironmental changes in a live cell. We improved the single-molecule optical microscopy to simultaneously acquire the location and spectrum of a tagged protein in a live cell. The schematic of the apparatus is sketched in Fig. 1(a). We positioned a transmission grating (300#/mm) before the imaging lens (L2) of the microscope. Thus, the zero-order diffracted image can provide the location data of the molecules with a spatial resolution of 30 nm; while the first-order diffracted image carries the spectral information. It is crucial to select an appropritate grating that can produce large enough spectral dispersion, but small enough to avoid overlap between two neighoring fluorophores. In Fig. 1(b), two cy3 fluorophores were emphasized. One locates at the position marked by red circle in the zero-order image, the other at the position emphasized by the blue circle. The spectrum emitted by the fluorophores forms a line in the first-order image emphasized by the red and blue rectangles, respectively. By knowing the positions of the fluorophores and the grating dispersion parameter, we can calibrate the wavelength of the spectrum. The resulting spectra are shown in Fig. 2(c), revealing a clear spectral shift from the two cy3 fluorophores. The spectral changes are mainly due to that the rings of cy3 molecule do not lie on the same plane. The dihedral angle between two ring planes can be perturbed by its environment, which reduces the \(\pi \)-conjugation of the molecule and causes the light emitting properties to change. (a)
 (b) (b)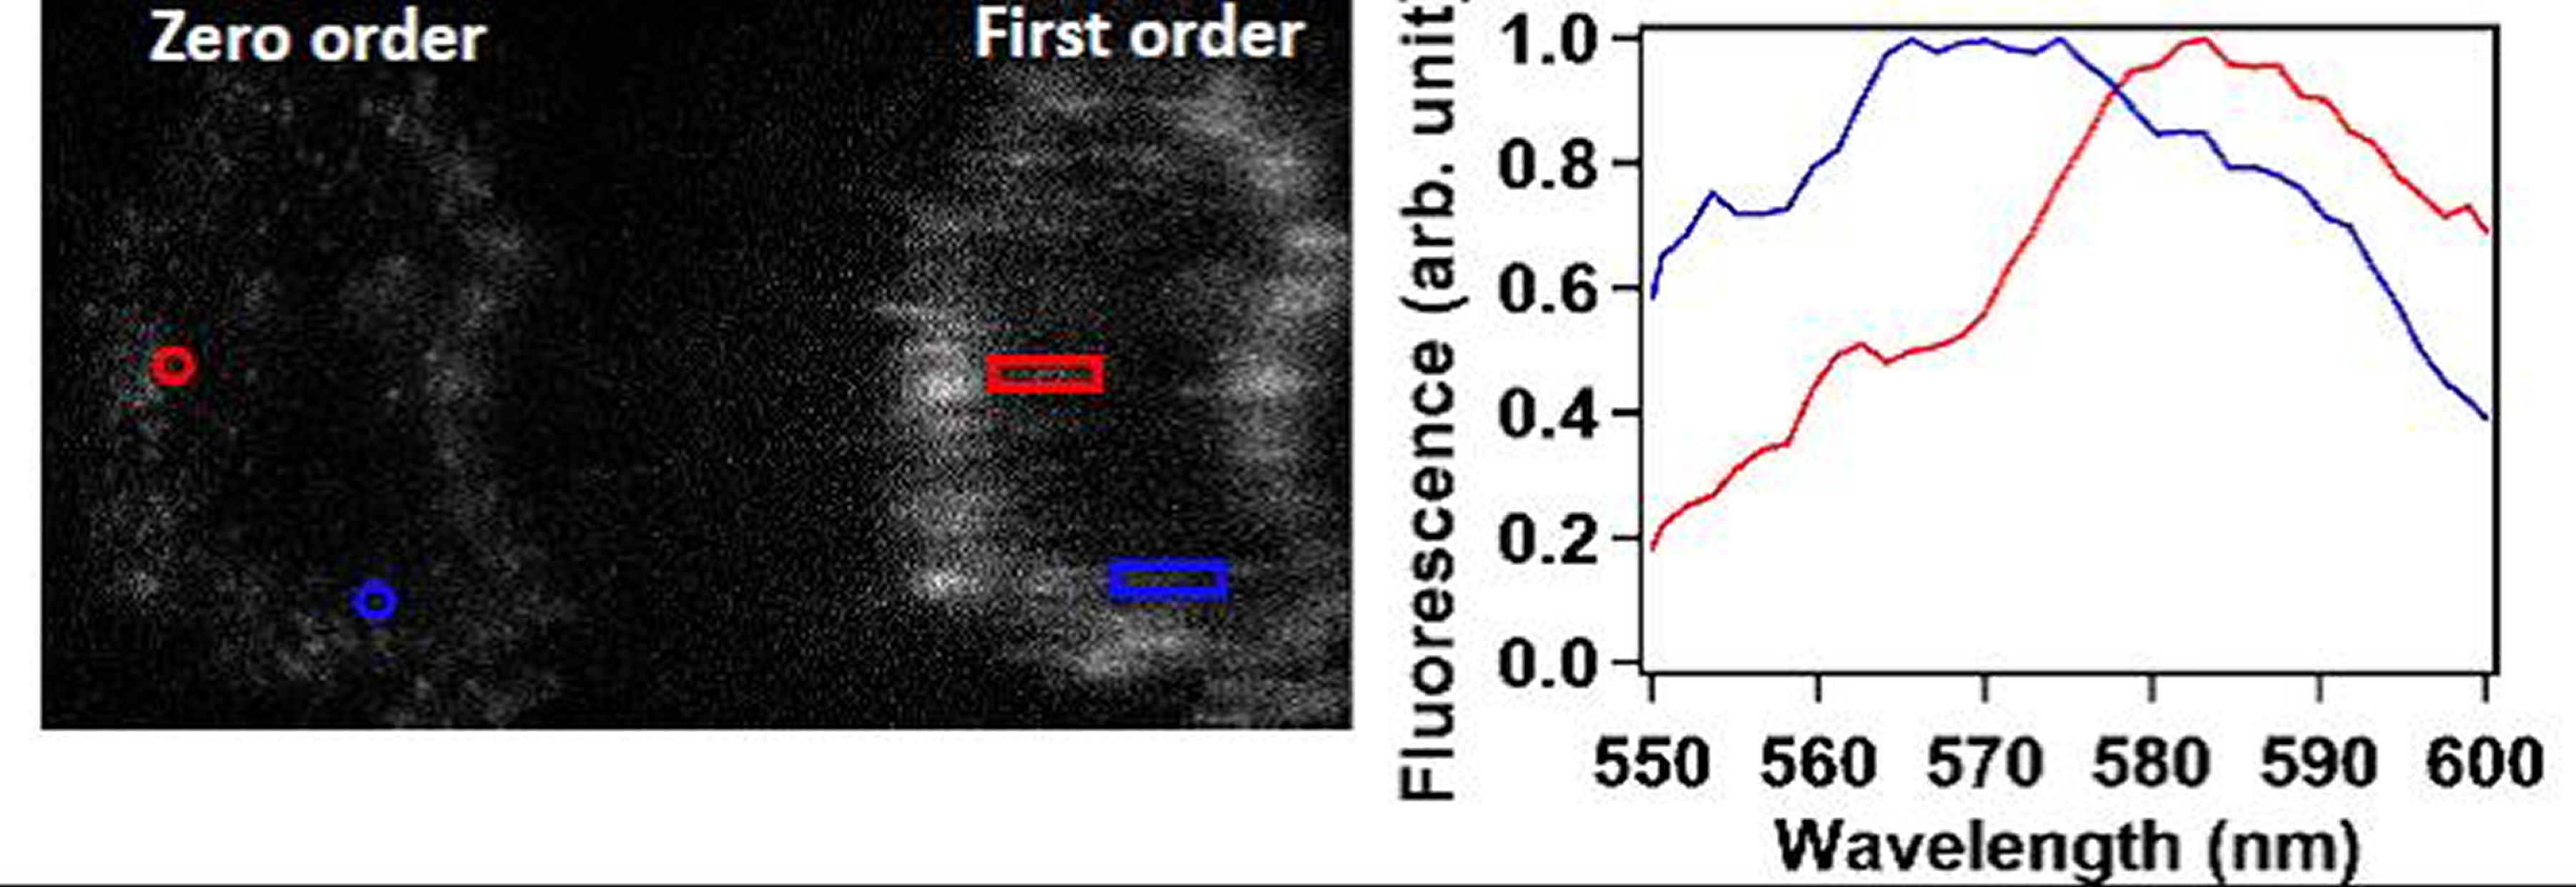 (c) (c)
FIG. 1: (a) Experimental setup for probing single-molecule dynamics in live cells by simultaneous detection of the nanometer localization and spectrum of fluorescent tag on EGFR of a live cell. (b) Real-time image (zero-order diffraction image) and the corresponding fluorescent spectra (first-order diffraction image) on a live He-La cell. (c) The fluorescent spectra present in the blue and red rectangular boxes shown in (b). Hence we had developed a methodology that can simultaneously measure the locations and spectra of probing molecules in live cells. By exploiting the spectral sensitivity of probing molecules we can deduce the environmental change of the molecules. This technique possesses both the advantages of single-molecule sensitivity and parallel detection. Thus, we can collect the spatial and spectral data of single-molecule receptors in live cells rapidly to achieve sufficient statistics for analysis. We used an EGFR antibody conjugated with cy3 fluorophore (cy3-ab) to tag EGFR (cy3-ab-EGFR) and maked them visible on a live cell. Fig. 2(a) shows the histogram of fluorescent intensity from cy3-ab-EGFRs before (solid bars) and after (open bars) the cells were activated by EGF. As shown, the average fluorescent intensity increases by a factor of 2 from \(6.5 \times {10^3}\) to \(1.25 \times {10^4}\). By analyzing the distribution profile quantitatively, we can further deduce that EGFR monomers and less than 10% dimers coexist on a rest live cell. As the cells were activated with EGF, the population of EGFR dimer increases to more than 40% (see Fig. 2(b)). 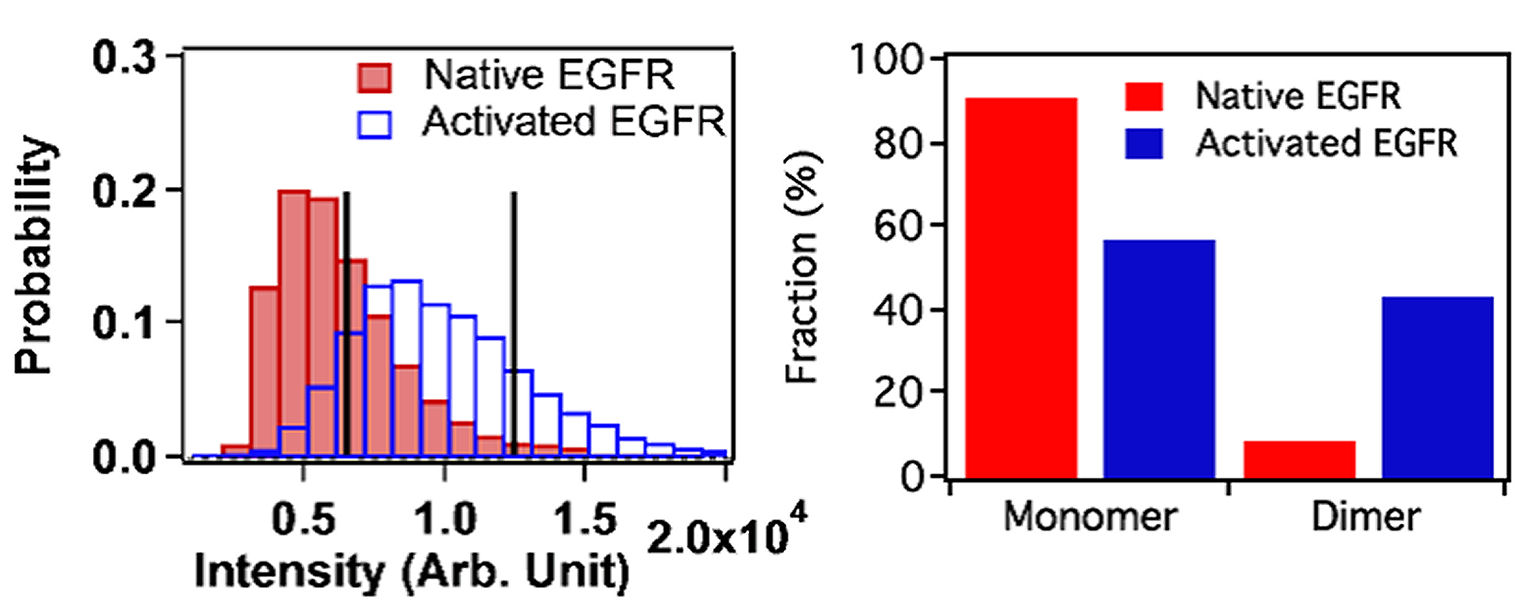
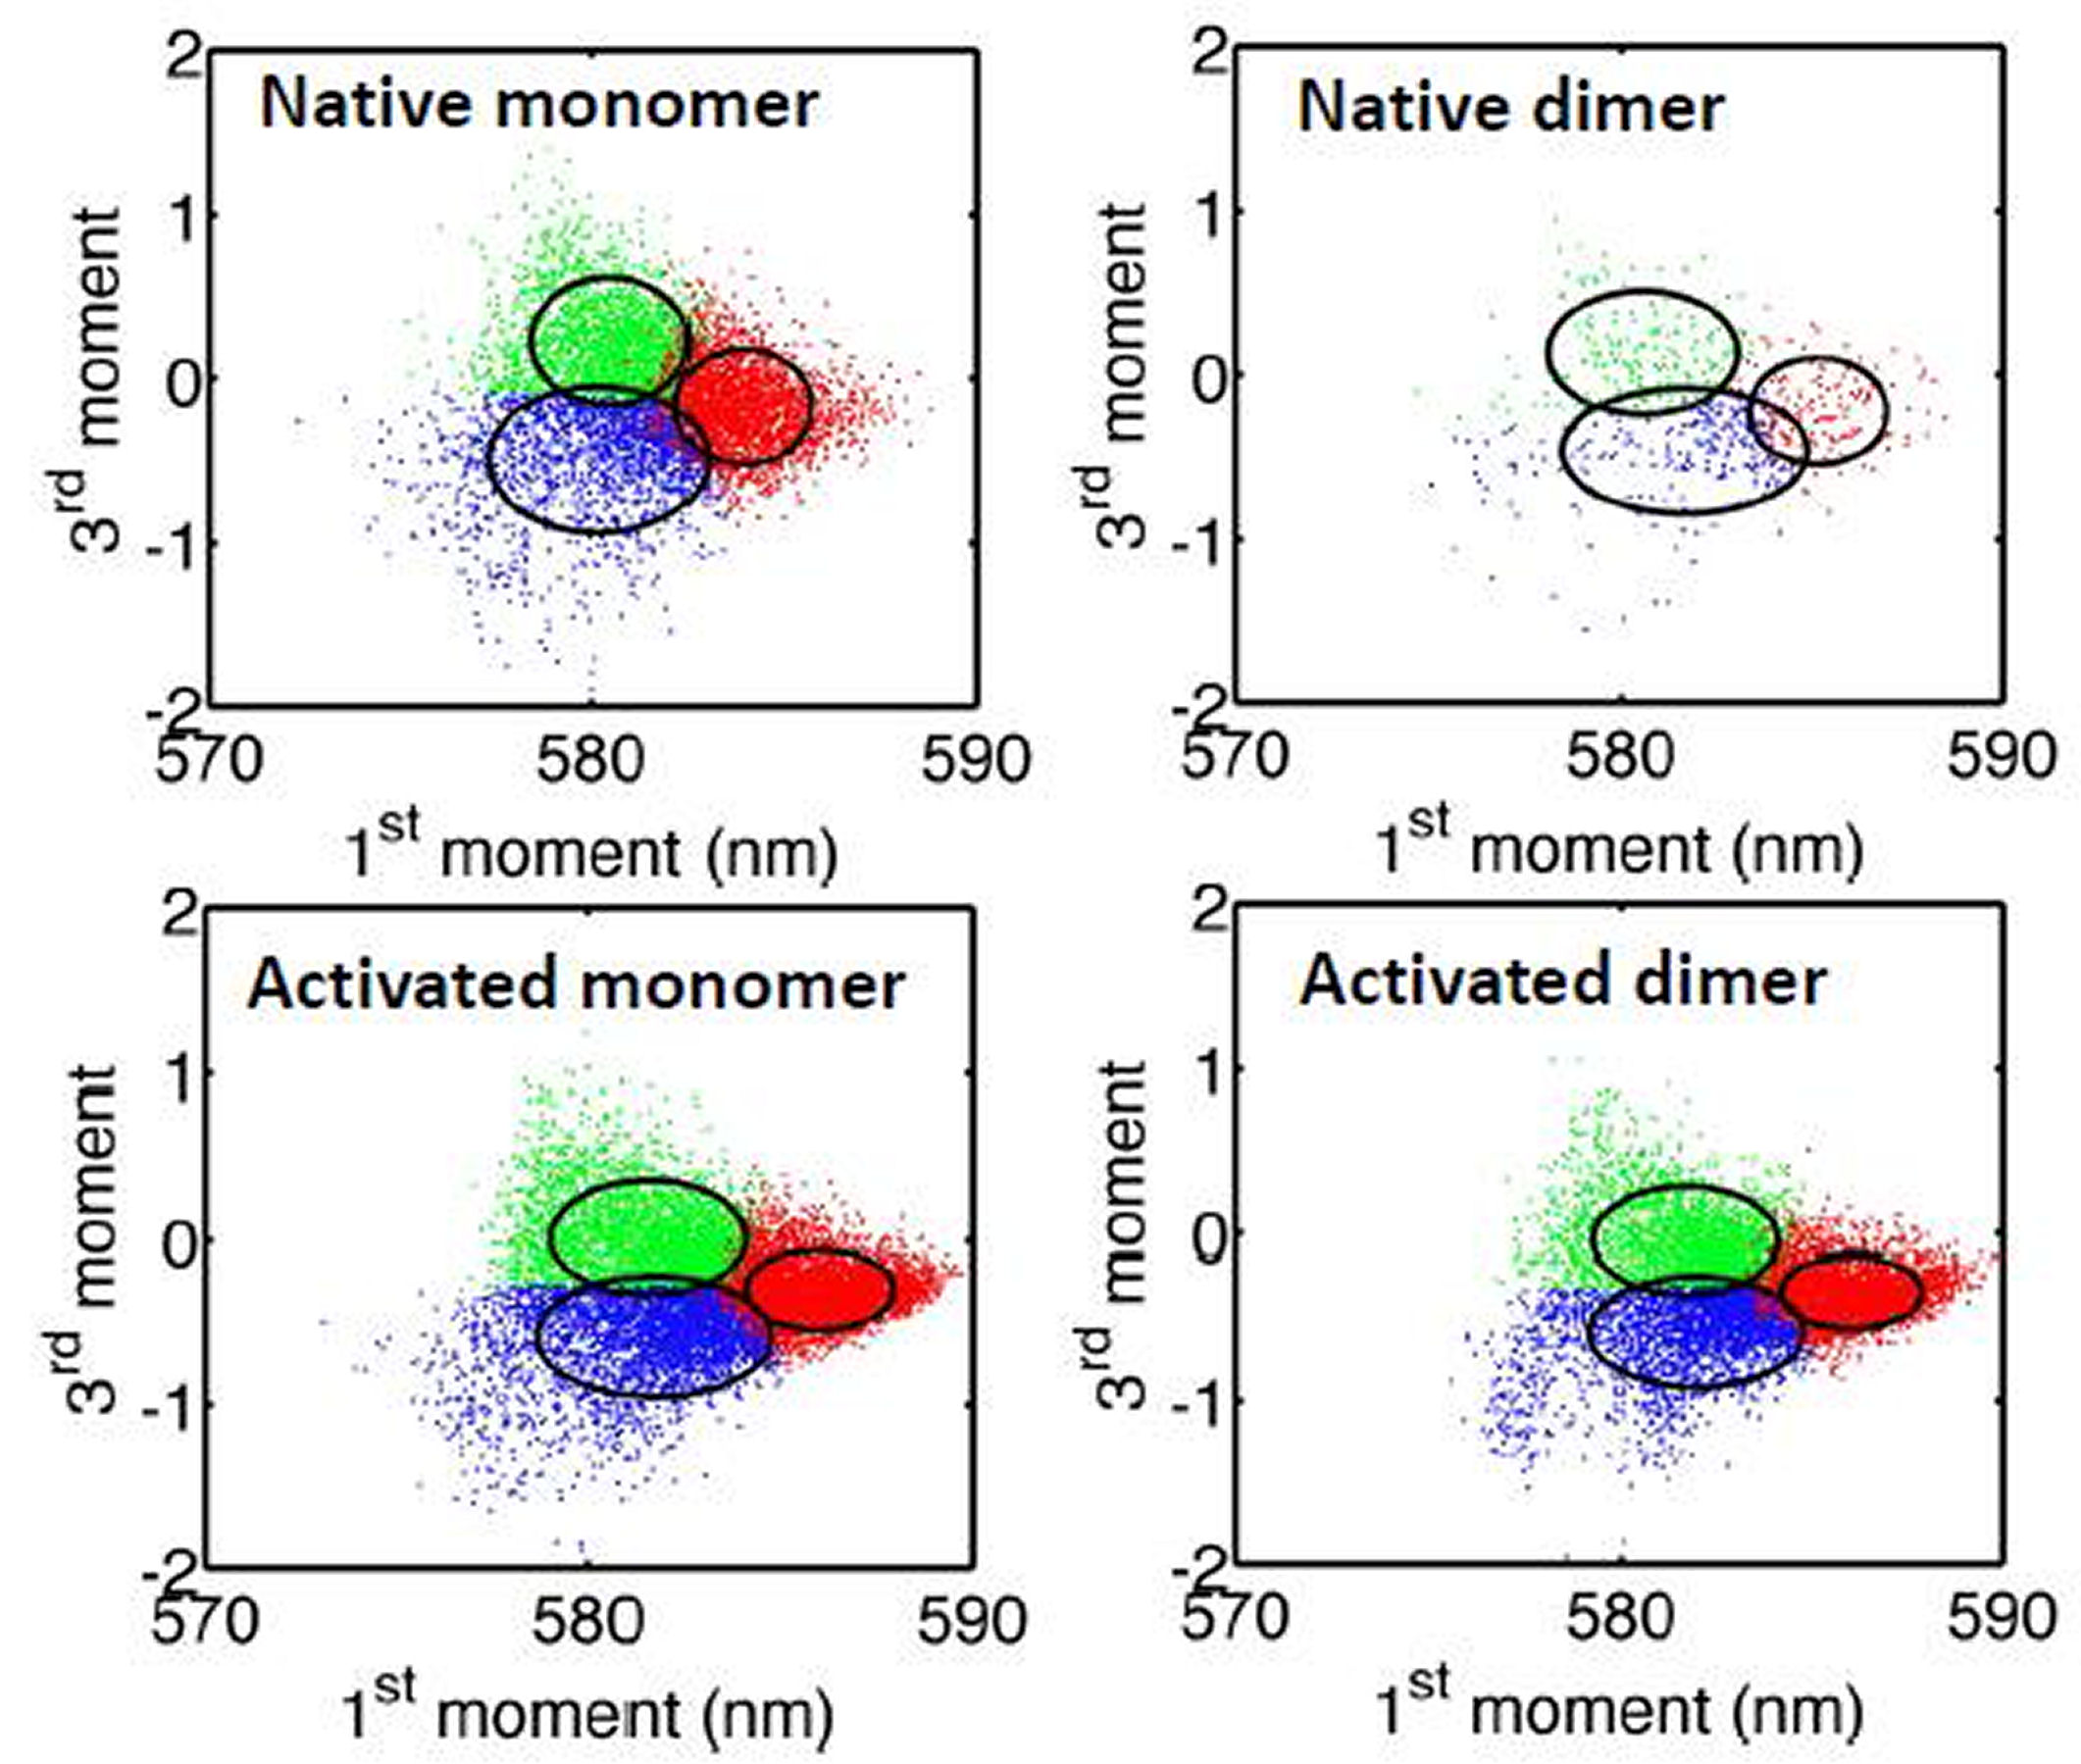
FIG. 2: (a) Histogram of fluorescent intensity from cy3-abEGFR-EGFR, and the deduced population fractions of the EGFR monomers and dimers on live He-La cells before (native: red color) and after adding EGF (activated: blue color). To further deduce the EGFR environments on a live cell from the acquired spectra, we reduced a spectral profile into the following four characteristic parameters: zero moment (fluorescent intensity), first moment (central wavelength), variance (spectral bandwidth), and third central moment (left-right asymmetry). The histogram of the zero moment from EGFRs on rest and activated cells are shown in Fig. 2(a). A strong correlation between the first moment and third central moment can be found in Fig. 3(a). By using the machine learning classification with self-organizing map algorithm, we were able to separate the spectra from cy3-ab-EGFRs into three groups. The first class has an enhaced spectrum on long wavelength side (marked by green in Fig. 3(a)). The second group possesses an enhaced spectrum on short wavelength side (marked by blue). The third one has a red-shifted spectrum (marked by red). (a)
 (b) (b)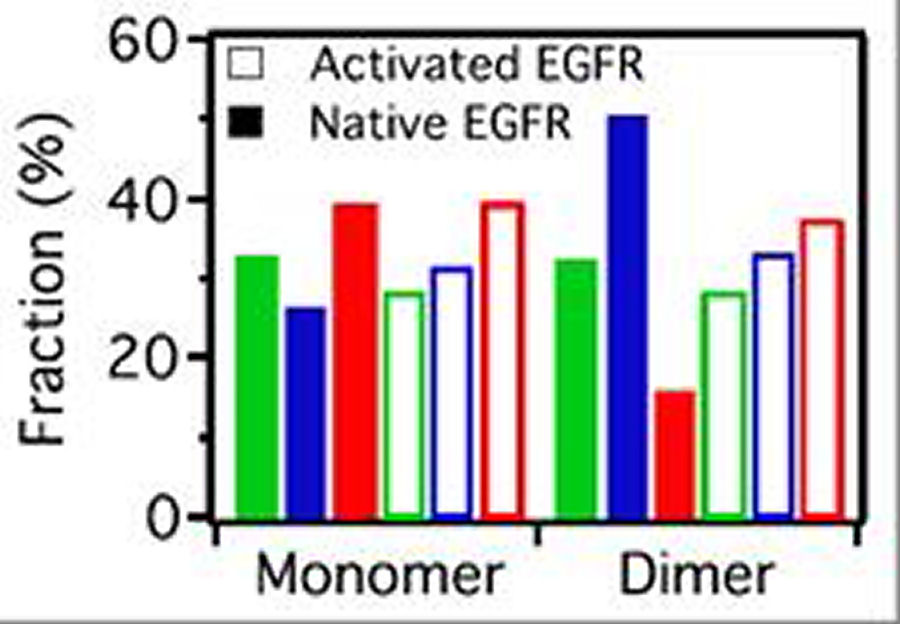
FIG. 3: Correlation of the third central moment and the first moment of the spectra of cy3 attached to EGFR on live He-La cells. (b) The deduced population fractions of the EGFR monomers and dimers before (native: solid bars) and after adding EGF (activated: open bars). Except an increase in EGFR dimer population by EGF activation, the population of EGFR monomers locating in an environment that results in an enhanced spectrum on long wavelength side decreases; whereas the population of EGFR monomers in an environment with an enhanced short-wavelength spectrum increases. The population of monomer species with red-shifted spectrum remains unchange. In contrast, EGF activation decreases the blue-color population of EGFR dimers; whereas increases the red-color population of EGFR dimers. In summary, the environments of EGFR monomers and dimers in rest cell differ significantly. However, after activation by EGF, the environments of EGFR monomers and dimers are similar. This finding agrees with our recent study reported above, which showed that unliganded EGFRs at rest are located outside the lipid raft domains. EGF binding caused the receptors to move into the lipid raft domains. The lipid domains surrounding two liganded EGFR molecules undergoing correlated motion can merge. This shall result in an environment similar to that of EGFR monomer in an activated cell. In a real situation, the spectrum from a cy3-ab-EGFR varies along the trajectory. Every set of the characteristic parameters presented in Fig. 3(a) was deduced from a spectrum averaged over the single-molecule trajectory. To resolve the spectral features at different positions along a trajectory the trajectory was divided with a duration of 0.25s. We then extracted the time-resolved parameters from the spectra and deduced the class-resident times. The results are presented in Fig. 4, showing the resident times of EGFRs in rest cells lie in a rnage of 1.57-1.60 s. After EGF activation, the resident times were increased to 2.58-3.05 s, indicating that after EGF activation, EGFRs diffuse more slowly that that in rest cells. 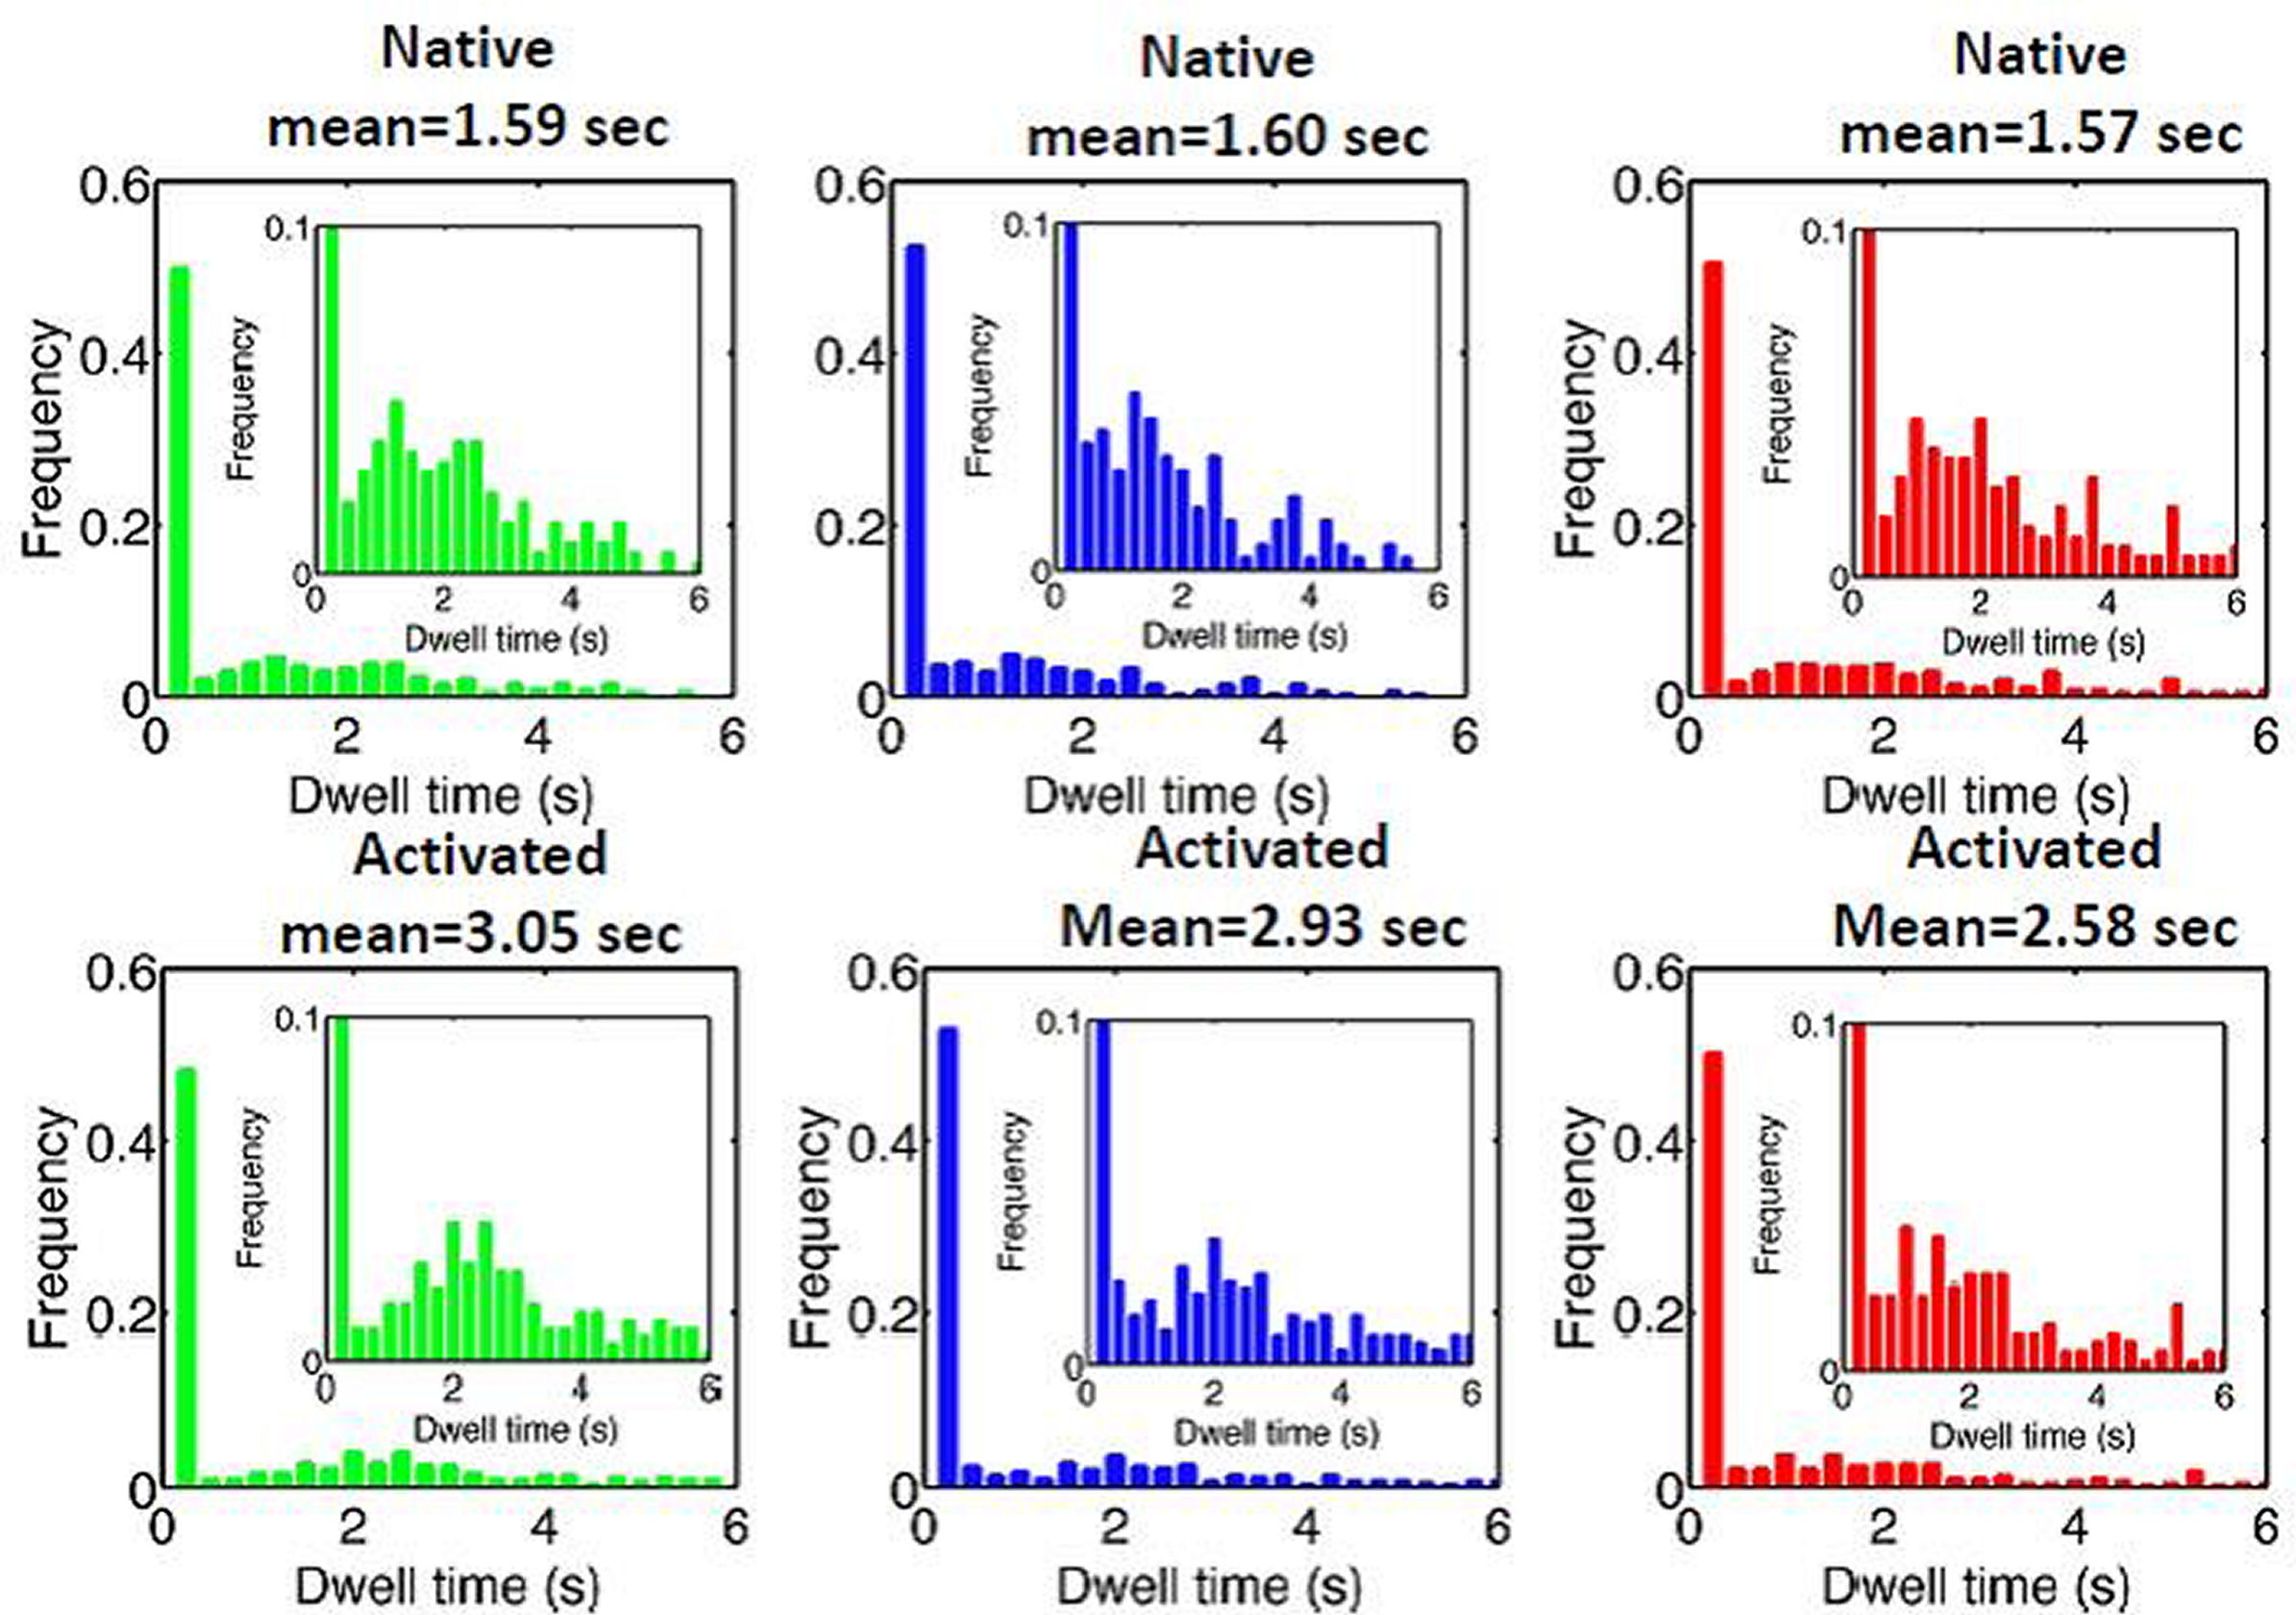
FIG. 4: Histograms of the dwell times of EGFR on the three different states (red, blue, and green) of cy3 attached to EGFR on live He-La cells. Top row: before adding EGF (native) and Bottom row: after adding EGF (activated). We can also deduce the local mean-squared displacement (MSD) from trajectories with a time resolution of \(\tau \)=0.25 s. The result was shown in Fig. 5. The effective diffusion coefficient of EGFR can be determined with \({D^*} = MSD/(4\tau )\). Apparently, after EGF activation, EGFRs have lower diffusion coefficient than that in rest cells as expected from Fig. 4. 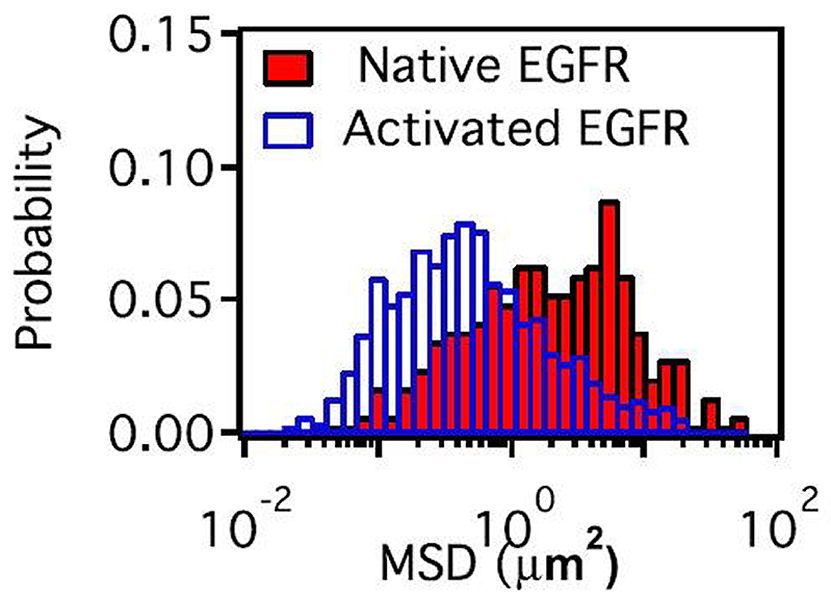
FIG. 5: Histograms of MSD of EGFR on live He-La cells before (Native: solid bars) and after (Activated: open bars) adding EGF. In summary, 90% EGFRs in monomer and less than 10% in dimer were found to coexist in a live cell. After EGF activation, the EGFR dimer population increases to 40%. EGFRs in live cells are distributed in three different environments. The resident times of EGFR monomers in the three environments increase from 1.57-1.60 s in rest cells to 2.58-3.05 s in activated cells, indicating that EGFRs diffuse more slowly after EGF activation. This finding agrees with our recent study, showing that unliganded EGFRs at rest are located outside the lipid raft domains. EGF binding caused the receptors to move into the lipid domains. The lipid domains surrounding two liganded EGFR molecules undergoing correlated motion can merge, resulting in an environment similar to that of EGFR monomer in an activated cell. If you have any feedback you like to share, I will appreciate to hear about it. Please hit |
V. Unraveling the mechanism of correlated movement of dual receptor proteins in plasma membranes in vivoLigand-induced receptor dimerization is a crucial step in the signaling process of living cells. The diffusion of paired receptors in plasma membrane can be a ected by the constraints imposed by membrane architecture. In this study, we develop a theoretical model and perform single-molecule optical tracking to decipher the underlying mechanism of correlated movement of receptor proteins before a dimer is formed. We discover that an attractive force from a protein-induced lipid ordering and correlated environmental fluctuations play an important role to yield the correlated motion. This methodology may also be useful to shed light on the way in which protein-protein interactions are regulated in plasma membranes in vivo. VI. Exploring in vivo cholesterol-mediated receptor-receptor interaction in plasma membrane with single-molecule optical trackingCholesterol in the plasma membrane can alter the signaling pathways of living cells. However, the process in which the interaction of receptor proteins is modulated remains unclear. In this study, we analyzed single-molecule optical trajectories of epidermal growth factor receptors (EGFRs) in two cancerous cell lines and one normal endothelial cell line and discovered that unliganded EGFRs reside in non-raft regions of the plasma membrane and can move into raft domains when subjected to ligand binding. We also observed that the amount of membrane cholesterol considerably a ects the correlation stability of EGFR pairs. Our methodology can be used to explain the mechanism of cholesterol-mediated receptor-receptor interactions in live cells. |
Super resolution imaging of live cellsOptics is a valuable tool in life science. If various optical processes are employed, the resulting techniques can possess both single-molecule sensitivity and minimum invasiveness. Single-molecule techniques have matured into powerful tools for probing the complex behaviors of biological molecules. Superresolution optical microscopy such as STORM/PALM often focused on probing the distributions of important biomolecules in fixed cells. Recently, pioneering work had been done to extend the technique into live cell research. In our lab, an experimental setup of super resolution optical microscopy with precise microfluidic manipulation of live cells has been installed (Fig. 1). 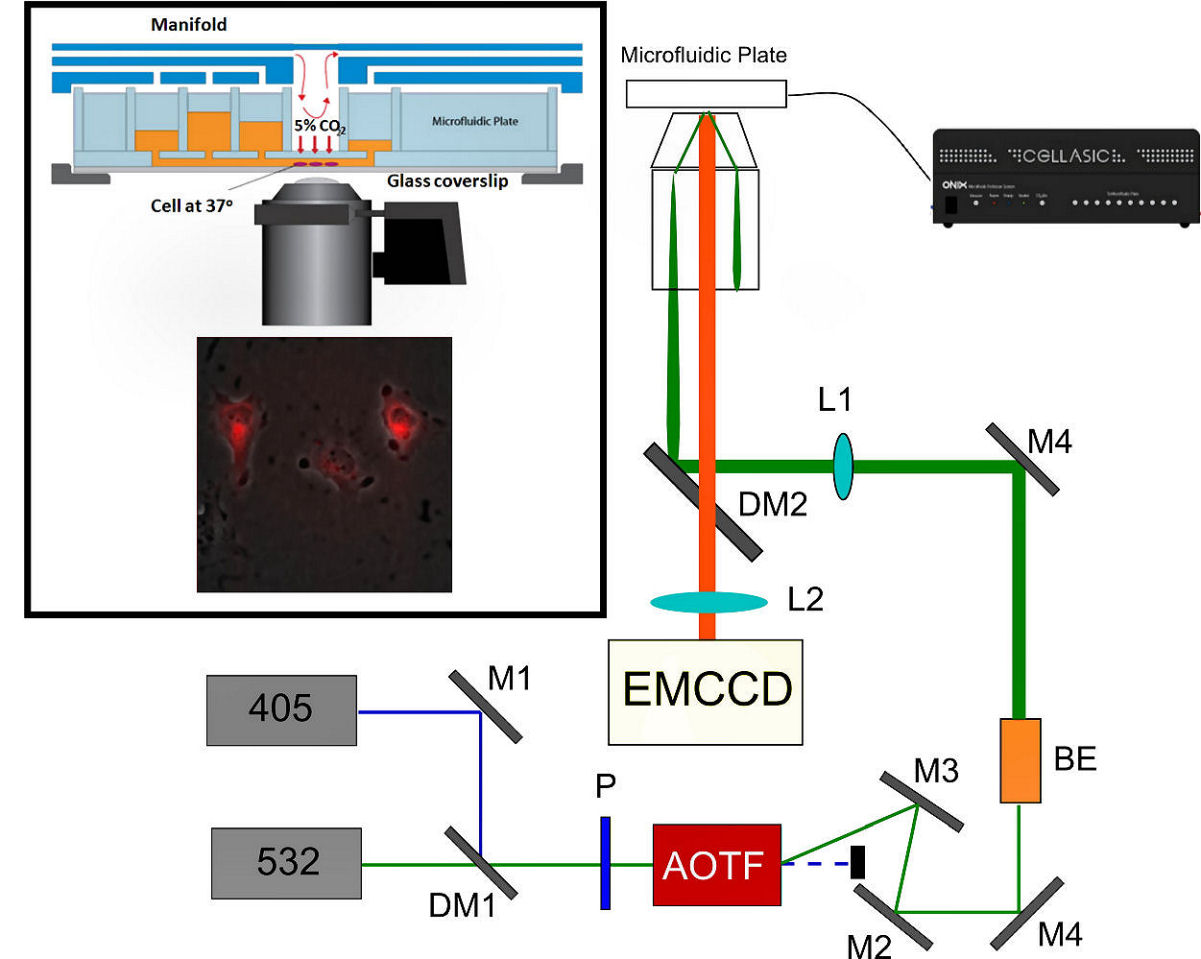
FIG. 1: Experimental setup used for probing the single-molecule processes in a live cell. The analytes and the interaction with a live cell are accurately controlled by combining microfluidic apparatus with real-time 3D optical microscopy. A. Super resolution imaging of live cells Here we demonstrate that STORM can be employed to probe the spatiotemporal dynamics of cell membranes in live CHO cells. Small DII fluorophores, after plugging into the plasma membrane, can be optically switched from the bright to dark states with 405 nm light as revealed in Fig. 2a. By repeating the process, we can aquire STORM image on a live CHO cell (see Fig. 2b). 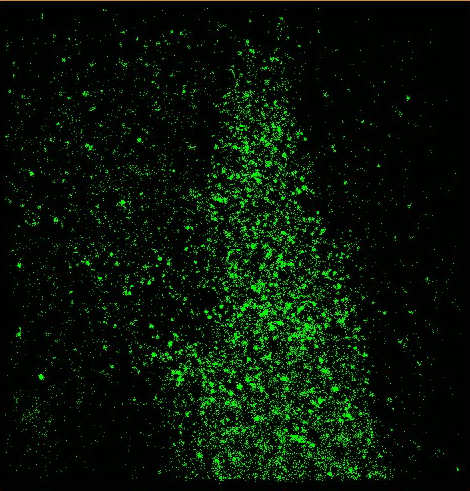
FIG. 2: (Left) DII fluorophores in the cell membrane of a live CHO cell are images with 532 nm. The fluorophores can be converted into the dark states by exposing to strong 532 nm light. The fluorophores in the dark state can be reactivated with 405 nm and the fluorescent image can be acquired with 532 nm. (Right) STORM image of a live CHO cell. B. Tracking single-molecule DII fluorophores on the cell membrane of a live cell We can track each DII fluorophores in the cell membrane at a spatiotemporal resolution of 40 nm and 50 msec, respectively. From the single-molecule trajectories (see Fig. 3a), we can determine the diffusion constant of DII in the cell membrane to be about 0.4-0.5 um2/sec, which is similar to the values reported in the literature. 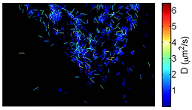 ___ ___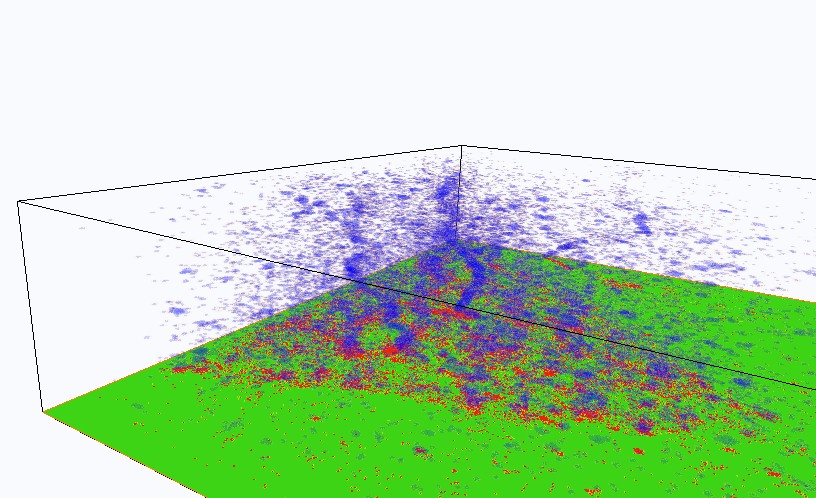
FIG. 3: (Left) Nanometer tracking of DII fluorophores in a live CHO cell. The dynamic STORM images are plotted with a temporal range of 60 seconds along the z-axis. The spatiotemporal STORM images of a live CHO cell can be plotted in Fig. 3b with the z-axis denoting the time direction. We find that the DII fluorophores are partitioned into several domains, presumably due to the underlying cytoskeleton. Based on the image, we can calculate the pair correlation function g(r) of DII fluorophores in the cell membrane, Pair correlation function gives the probability of finding another particle at a distance r given a particle at 0. We administered cytochalasin D to the live cell, which suppresses actins from polymerization and causes cytoskeleton to disband. The pair correlation function of DII in the intact cell membrane of a live CHO cell shown in Fig. 4 yields a correlation length of 180 nm (note: typical compartment size of actin ~230 nm). The correlation length is increased to 335 nm after cytochalasin D administration, reflecting the structural changes of plasma membrane in a live cell.  of Dii in live cells.png)
FIG. 4: Pair correlation function of DII fluorophores in a cell membrane of a live CHO cell. red: in native state, blue: cell is adminstered with cytochalasin D to suppress actins from polymerization. Next, we employed the super resolution dynamic optical microscopy to investigate the dynamic structure of lipid raft on a live cell. We used cholera toxin sub unit B (CTB) with alexa-488 fluorophore to label GM1 ganglioside lipids of lipid raft. We found GM1 moves on cell membrane locally at a diffusion constant of 0.15 um2/sec, and then jumps to another domain, which is consistent with the model of picket-fence picture. As we administer Nystatin to sequester cholesterol molecules from the lipid rafts, the diffusion kinetics of GM1 changes. 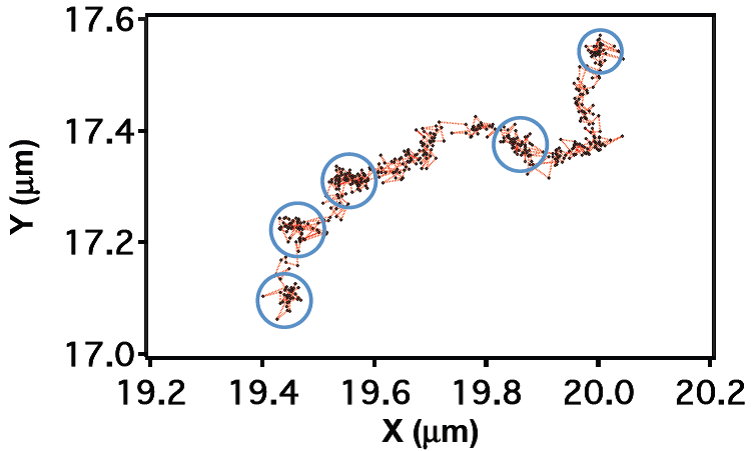
FIG. 5: Nanometer tracking of alexa 488-CTB specifically attached to GM1 lipids of a live cell. Please visit again in the near future for more information. |
Image Gallery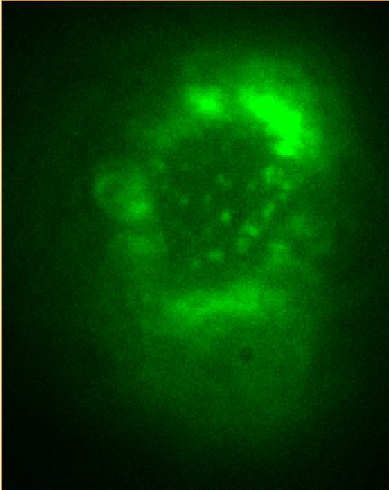 __ __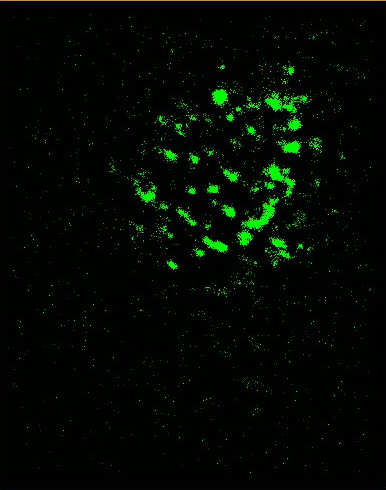 __ __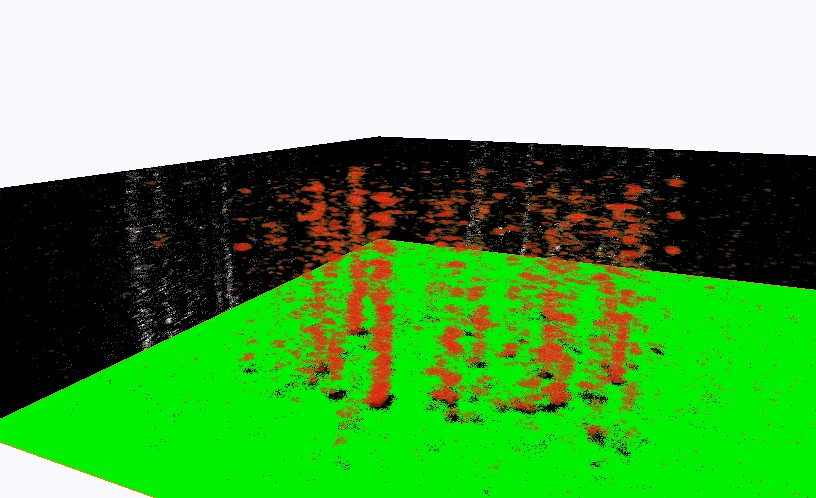
Figure Caption: (Left) FOM and STORM images of alexa488-CTB-GM1 of a live He-La cell. The dynamic STORM images are plotted with a temporal range of 60 seconds along the z-axis. 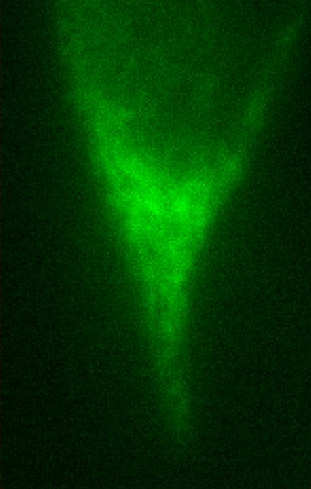 __ __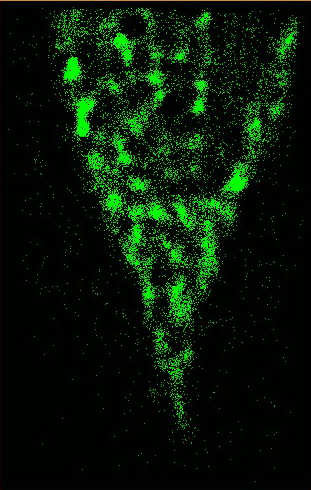
Figure Caption: FOM and STORM images of DII of a live He-La cell.
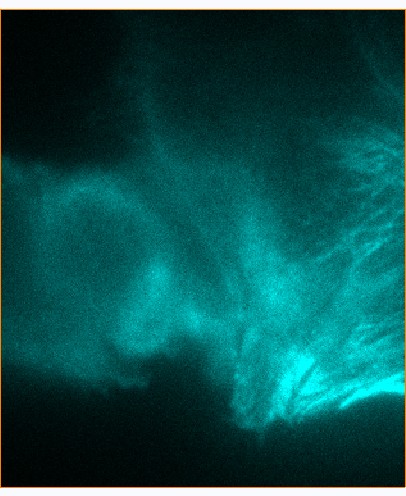 __ __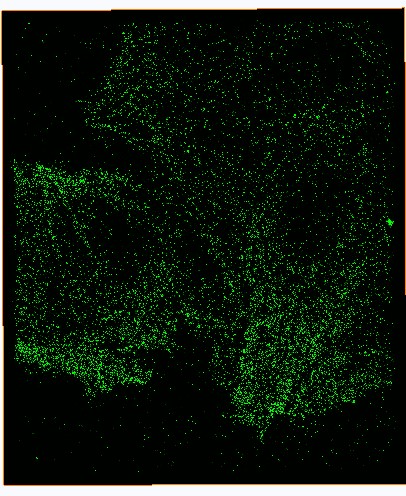
Figure Caption: FOM and STORM images of microtubulins in a fixed CHO cell. |